Difference between revisions of "Water Quality Page"

From Glen Canyon Dam AMP
Jump to: navigation, search
(add Temperature- pre and post dam- GRAPH.jpg)
(add Thermal Profiles in Lake Powell- Graph.jpg)
Line 164: Line 164:
 
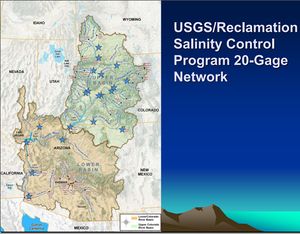
Image:Diagram- USBR Colorado River Basin Salinity 09.jpg
 
Image:Diagram- USBR Colorado River Basin Salinity 09.jpg
 
Image:Temperature- pre and post dam- GRAPH.jpg  
 
Image:Temperature- pre and post dam- GRAPH.jpg  
Image:CRC_0010.JPG
+
Image:Thermal Profiles in Lake Powell- Graph.jpg
 
Image:CRC_0011.JPG
 
Image:CRC_0011.JPG
 
Image:CRC_0012.JPG
 
Image:CRC_0012.JPG

Revision as of 09:49, 18 July 2013


250px‎

Water Quality - Colorado River The quality of water in the Colorado River is important. Water quality includes, but not limited to, temperature, water column structure, total suspended solids, dissolved oxygen, total dissolved solids, and chlorophyll.


TBD
(Motions)
TBD
(TBD)
TBD
(TBD)

GROUP MEMBERS


News


Water Quality Links

General

  • GCMRC Monitoring Stations Map

[http://www.gcmrc.gov/discharge_qw_sediment/stations/GCDAMP GCMRC Maps and Spatial Data] [1]

Temperature

  • USGS 09380000 COLORADO RIVER AT LEES FERRY, AZ

[2]

  • USGS 09380000 COLORADO RIVER AT LEES FERRY, AZ

[3]

  • USGS 09421500 COLORADO RV BLW HOOVER DAM, AZ-NV

[4]

Salinity

2011 Water quality standards for salinity

[5]

  • Station ---------------- Salinity in mg/L
    • Below Hoover Dam 723
    • Below Parker Dam 747
    • At Imperial Dam 879

[6]


Lake Mead


  • MONITORING HISTORY
  1. Water-quality sampling in Lake Powell was initiated by the USBR in 1964 and continued through 1990.
  2. Glen Canyon Environmental Studies conducted the monitoring from 1990-1996.
  3. The USGS Water Resources Discipline conducted monitoring in Lake Powell on several dates in 1992, 1994, and 1995.
  4. Since 1997, monitoring has been conducted by the USGS-GCMRC.

State of the Colorado River Ecosystem in Grand Canyon- USGS Circular 1282


USBR LINKS

Reports and Links

  • br>

Other Stuff