Difference between revisions of "Water Quality Page"
From Glen Canyon Dam AMP
(Add information about economic damages to Lower Basin caused from salinity) |
(add 201410 NDW Article Our Water Keeping it Clean) |
||
| (10 intermediate revisions by the same user not shown) | |||
| Line 107: | Line 107: | ||
*Q: How could increases in salinity levels affect Lake Mead? | *Q: How could increases in salinity levels affect Lake Mead? | ||
A: The associated costs might be felt from homeowners in the form of increases in corrosiveness to water fixtures/ pipes and more salt needed in the water softeners. | A: The associated costs might be felt from homeowners in the form of increases in corrosiveness to water fixtures/ pipes and more salt needed in the water softeners. | ||
| − | *Q'''How do concentrations of salts (salinity) in the Colorado River cause economic damages to the Lower Basin?''' | + | *Q: '''How do concentrations of salts (salinity) in the Colorado River cause economic damages to the Lower Basin?''' |
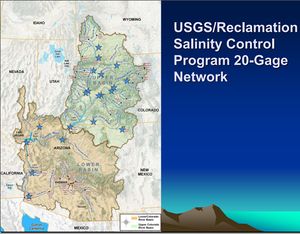
*[Source: SNWA-CRC] The concentrations of salts in the Colorado River cause approximately $376 million in quantified damages in the Lower Basin each year and significantly more immeasurable damages. Modeling by the USBR indicates that quantifiable damages will rise to approximately $577 million per year by 2030 without the Salinity Control Program's continuation. | *[Source: SNWA-CRC] The concentrations of salts in the Colorado River cause approximately $376 million in quantified damages in the Lower Basin each year and significantly more immeasurable damages. Modeling by the USBR indicates that quantifiable damages will rise to approximately $577 million per year by 2030 without the Salinity Control Program's continuation. | ||
*Colorado River water increases from about '''50''' mg/L at its headwaters to more than '''700''' mg/L in the Lower Basin. High salt levels in the water cause significant economic damages downstream: | *Colorado River water increases from about '''50''' mg/L at its headwaters to more than '''700''' mg/L in the Lower Basin. High salt levels in the water cause significant economic damages downstream: | ||
| Line 126: | Line 126: | ||
|class="MainPageBG" style="width:45%; border:1px solid #cedff2; background:#f5faff; vertical-align:top;"| | |class="MainPageBG" style="width:45%; border:1px solid #cedff2; background:#f5faff; vertical-align:top;"| | ||
{| width="100%" cellpadding="2" cellspacing="5" style="vertical-align:top; background:#f5faff;" | {| width="100%" cellpadding="2" cellspacing="5" style="vertical-align:top; background:#f5faff;" | ||
| − | ! <h2 style="margin:0; background:#cedff2; font-size:120%; font-weight:bold; border:1px solid #a3b0bf; text-align:left; color:#000; padding:0.2em 0.4em;"> | + | ! <h2 style="margin:0; background:#cedff2; font-size:120%; font-weight:bold; border:1px solid #a3b0bf; text-align:left; color:#000; padding:0.2em 0.4em;">News related LINKS</h2> |
|- | |- | ||
|style="color:#000;"| | |style="color:#000;"| | ||
| − | * | + | *[[Media:201410 NDW Article Our Water Keeping it Clean.pdf |201410 NDW Article Our Water Keeping it Clean-- Green and Blue Algae]] |
* | * | ||
* | * | ||
| Line 137: | Line 137: | ||
|- | |- | ||
|style="color:#000;"| | |style="color:#000;"| | ||
| − | * | + | *[[Media:USBR-Las Vegas Wash 2012 Final Report- August 2014-PRINT.pdf |USBR-Las Vegas Wash 2012 Final Report- '''August 2014''']] |
| + | *[[Media:2014-47 40 Years Ago - The Genesis of the Salinity Control Program (1).pdf |2014-47 40 Years Ago - The Genesis of the Salinity Control Program]] | ||
* | * | ||
| Line 163: | Line 164: | ||
Image:Temperature- pre and post dam- GRAPH.jpg | Image:Temperature- pre and post dam- GRAPH.jpg | ||
Image:Thermal Profiles in Lake Powell- Graph.jpg | Image:Thermal Profiles in Lake Powell- Graph.jpg | ||
| − | Image: | + | Image:Turbidity USGS PIC.jpg |
| − | Image: | + | Image:150512 USGS-Water Quality MAP.jpg |
| − | Image: | + | Image:DIAGRAM- Turbidity and algae in Grand Canyon.jpg |
Image:CRC_0014.JPG | Image:CRC_0014.JPG | ||
Image:CRC_0015.JPG | Image:CRC_0015.JPG | ||
Image:CRC_0016.JPG | Image:CRC_0016.JPG | ||
| − | Image: | + | Image:PIC- Water Quality CR NPS.jpg |
Image:CRC_0018.JPG | Image:CRC_0018.JPG | ||
Image:CRC_0019.JPG | Image:CRC_0019.JPG | ||
Image:CRC_0020.JPG | Image:CRC_0020.JPG | ||
| + | |||
| Line 180: | Line 182: | ||
---- | ---- | ||
*The river’s water quality varies as it travels through different stretches and land uses. Runoff from agriculture, abandoned mines, and naturally occurring saline ground water discharges cause localized water quality problems. | *The river’s water quality varies as it travels through different stretches and land uses. Runoff from agriculture, abandoned mines, and naturally occurring saline ground water discharges cause localized water quality problems. | ||
| + | *ECONOMIC DAMAGES: (From Salinity) -- affected items include water heaters, washers, valves, faucets and the pipes themselves, and the costs of using more soap and softeners in laundry and dishwashers. Many plants are sensitive to salts around their roots, and high salinity water kills such plants. | ||
Latest revision as of 10:20, 24 November 2014
|
|
Water Quality - Colorado River The quality of water in the Colorado River is important. Water quality includes, but not limited to, temperature, water column structure, total suspended solids, dissolved oxygen, total dissolved solids, and chlorophyll.
|
| TBD (Motions) |
TBD (TBD) |
TBD (TBD) |
|---|
|
|


