Difference between revisions of "Hydrology"
Cellsworth (Talk | contribs) |
Cellsworth (Talk | contribs) |
||
| Line 129: | Line 129: | ||
|- | |- | ||
| − | ! <h2 style="margin:0; background:#cedff2; font-size:120%; font-weight:bold; border:1px solid #a3b0bf; text-align:left; color:#000; padding:0.2em 0.4em;"> | + | ! <h2 style="margin:0; background:#cedff2; font-size:120%; font-weight:bold; border:1px solid #a3b0bf; text-align:left; color:#000; padding:0.2em 0.4em;">Presentations and Papers</h2> |
|- | |- | ||
|style="color:#000;"| | |style="color:#000;"| | ||
Revision as of 16:23, 3 June 2016
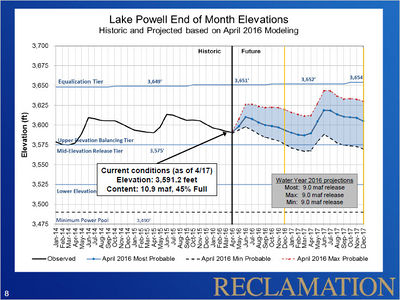
The unregulated inflow volume to Lake Powell in April was 814 thousand acre-feet (kaf) (77 percent of average). The release volume from Glen Canyon Dam in April was 665 kaf. The end of April elevation and storage of Lake Powell were 3,592 ft (108 feet from full pool) and 11.01 maf (45% of full capacity), respectively. The reservoir reached a seasonal low elevation on April 15th near elevation 3591.14 feet. Since that time the reservoir has been increasing as the first of the spring runoff is now entering the reservoir.
Inflow Forecasts and Model Projections
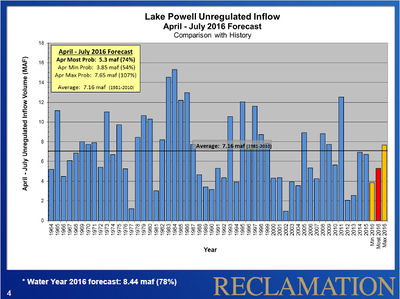
The April to July 2016 water supply forecast for unregulated inflow to Lake Powell, issued on May 3, 2016, by the Colorado Basin River Forecast Center, projects that the most probable (median) unregulated inflow volume will be 5.5 maf (77 percent of average based on the period 1981-2010). The forecast increased by 200 kaf since last month. At this point in the season, there is still uncertainty regarding this year’s water supply and the total inflow to Lake Powell. The spring runoff forecast ranges from a minimum probable of 3.85 maf (54 percent of average) to a maximum probable of 7.65 maf (107 percent of average). There is 10% chance that inflows could be higher than the maximum probable and a 10% chance they could be lower than the minimum probable.
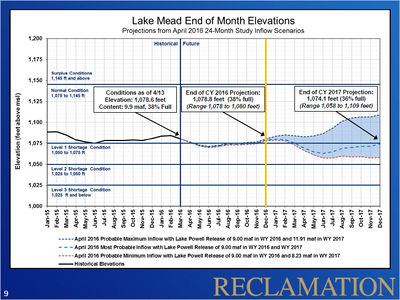
As determined in the August 2015 24-Month Study, and documented in the 2016 Annual Operating Plan, Lake Powell’s operations in water year 2016 will be governed by the Upper Elevation Balancing Tier. Because the April 2016 24-Month Study projected the end of water year elevation at Lake Powell to be above 3,575 feet and the end of water year elevation at Lake Mead to be below elevation 1,075.0 feet, Lake Powell operations shifted to balancing (Section 6.B.4 of the 2007 Interim Guidelines) for the remainder of water year 2016. Under balancing, the contents of Lake Powell and Lake Mead will be balanced by the end of the water year, but not more than 9.0 maf and not less than 8.23 maf shall be released from Lake Powell.
Based on the May most probable inflow forecast, the annual release volume from Lake Powell during water year 2016 is projected to be 9.0 maf. Under the minimum probable inflow scenario, the water year release is projected to be 9.0 maf. Under the maximum probable inflow scenario, the release is projected to be 9.0 maf. There is 10% chance that inflows will be lower than the current minimum probable forecast, potentially resulting in lower releases. If inflows are less than the minimum probable forecast, the water year 2016 annual release could be as low as 8.23 maf. If inflows are greater than the current forecasted maximum probable inflow, the annual release will be 9.0 maf. The projected release from Lake Powell in water year 2016 will be updated each month throughout the remainder of the water year.
Based on the current forecast, the May 24-Month Study projects Lake Powell elevation will end water year 2016 near 3,603 ft with approximately 12.06 maf in storage (50% capacity). Projections of elevation and storage still have significant uncertainty at this point in the season, primarily due to uncertainty regarding spring runoff and the resulting inflow to Lake Powell. Under the minimum probable inflow scenario, updated in April, the projected end of water year elevation and storage are 3585 ft and 10.35 maf (43% capacity), respectively. Under the maximum probable inflow scenario, updated in April, the projected end of water year elevation and storage are 3622 ft and 14.01 maf (58% capacity), respectively. Modeling of projected reservoir operations based on the minimum and maximum scenarios will be updated again in August.
|
|
| Table- Hydrology of the Colorado River |
--- | --- |
|---|
|
|


