Difference between revisions of "Hydrology"

From Glen Canyon Dam AMP
Jump to: navigation, search
Line 60: Line 60:
 
*[http://www.usbr.gov/lc/region/g4000/weekly.pdf Lower Colorado Water Supply Report]
 
*[http://www.usbr.gov/lc/region/g4000/weekly.pdf Lower Colorado Water Supply Report]
 
*[http://www.usbr.gov/lc/region/g4000/wtracct.html Lower Colorado River Water Accounting]
 
*[http://www.usbr.gov/lc/region/g4000/wtracct.html Lower Colorado River Water Accounting]
https://www.usbr.gov/uc/water/rsvrs/ops/aop/index.html
+
*[https://www.usbr.gov/uc/water/rsvrs/ops/aop/index.html Annual Operating Plans for Colorado River reservoirs]
  
 
== '''USBR Monthly/Annual Reports''' ==
 
== '''USBR Monthly/Annual Reports''' ==

Revision as of 12:23, 6 February 2017


KeepCalmHope4Snow.jpg

Current Status, Operations, and Forecasts

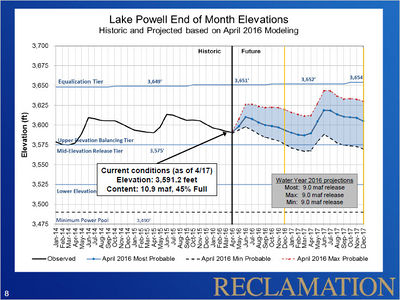
2016 Operating Tier

The operating tier for water year 2016 was established in August 2015 as the Upper Elevation Balancing Tier. The April 2016 24-Month Study established that Lake Powell operations will be governed by balancing for the remainder of water year 2016. Under balancing, the contents of Lake Powell and Lake Mead will be balanced by the end of the water year, but not more than 9.0 maf and not less than 8.23 maf shall be released from Lake Powell. Based on the most probable inflow forecast, this June 24-Month Study projects a balancing release of 9.0 maf in water year 2016; the actual release in water year 2016, however, will depend on hydrology in the remainder of water year and will range from 8.23 to 9.0 maf. The projected release from Lake Powell in water year 2016 will be updated each month throughout the remainder of the water year. Reclamation will schedule operations at Glen Canyon Dam to achieve as practicably as possible the appropriate total annual release volume by September 30, 2016.

---
Table- Hydrology of the Colorado River ---

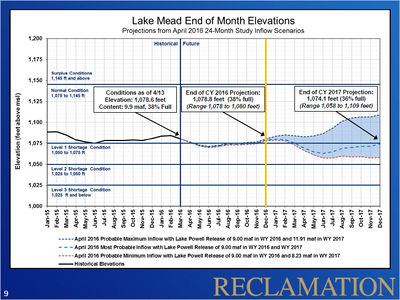
Reservoir Elevations

2016 PowellElevations.jpg 2016 MeadElevations.jpg


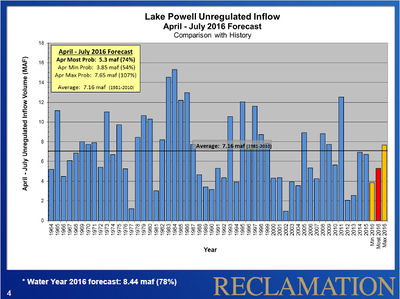
Inflows to Lake Powell

2016 LakePowellInflow.jpg


USBR Weekly Water Reports

USBR Monthly/Annual Reports

Snow Pack Reports

U.S. Drought Monitor


Water Flow Gages

Presentations and Papers

2016

2015

2014

2013

Other Stuff

Operational Flexibility

In addition to daily scheduled fluctuations for power generation, the instantaneous releases from Glen Canyon Dam may also fluctuate to provide 40 megawatts (mw) of system regulation. These instantaneous release adjustments stabilize the electrical generation and transmission system and translate to a range of about 1,200 cfs above or below the hourly scheduled release rate. Under system normal conditions, fluctuations for regulation are typically short lived and generally balance out over the hour with minimal or no noticeable impacts on downstream river flow conditions.

Releases from Glen Canyon Dam can also fluctuate beyond scheduled releases when called upon to respond to unscheduled power outages or power system emergencies. Depending on the severity of the system emergency, the response from Glen Canyon Dam can be significant, within the full range of the operating capacity of the power plant for as long as is necessary to maintain balance in the transmission system. Glen Canyon Dam typically maintains 30 mw (approximately 880 cfs) of generation capacity in reserve in order to respond to a system emergency even when generation rates are already high. System emergencies occur fairly infrequently and typically require small responses from Glen Canyon Dam. However, these responses can have a noticeable impact on the river downstream of Glen Canyon Dam.

Hydrologic Variability

The Upper Colorado River Basin regularly experiences significant year to year hydrologic variability. During the 16-year period 2000 to 2015, however, the unregulated inflow to Lake Powell, which is a good measure of hydrologic conditions in the Colorado River Basin, was above average in only 3 out of the past 16 years. The period 2000-2015 is the lowest 16-year period since the closure of Glen Canyon Dam in 1963, with an average unregulated inflow of 8.51 maf, or 79% of the 30-year average (1981-2010). (For comparison, the 1981-2010 total water year average is 10.83 maf.) The unregulated inflow during the 2000-2015 period has ranged from a low of 2.64 maf (24 percent of average) in water year 2002 to a high of 15.97 maf (147 percent of average) in water year 2011. The water year 2015 unregulated inflow volume to Lake Powell was 10.174 maf (94 percent of average), which, though still below average, was significantly higher than inflows observed in 2012 and 2013 (45% and 47 percent of average, respectively).