Difference between revisions of "Hydrology"
Cellsworth (Talk | contribs) |
Cellsworth (Talk | contribs) |
||
| Line 38: | Line 38: | ||
|class="MainPageBG" style="width:55%; border:1px solid #cef2e0; background:#f5faff; vertical-align:top; color:#000;"| | |class="MainPageBG" style="width:55%; border:1px solid #cef2e0; background:#f5faff; vertical-align:top; color:#000;"| | ||
{|width="100%" cellpadding="2" cellspacing="5" style="vertical-align:top; background:#f5faff;" | {|width="100%" cellpadding="2" cellspacing="5" style="vertical-align:top; background:#f5faff;" | ||
| − | ! <h2 style="margin:0; background:#cedff2; font-size:120%; font-weight:bold; border:1px solid #a3bfb1; text-align:left; color:#000; padding:0.2em 0.4em;"> | + | ! <h2 style="margin:0; background:#cedff2; font-size:120%; font-weight:bold; border:1px solid #a3bfb1; text-align:left; color:#000; padding:0.2em 0.4em;"> Updates </h2> |
|- | |- | ||
|style="color:#000;"| | |style="color:#000;"| | ||
| − | |||
| − | |||
| − | |||
| − | |||
| − | |||
| − | |||
| − | |||
| − | |||
| − | |||
| − | |||
| − | |||
| − | |||
== '''USBR Weekly Water Reports''' == | == '''USBR Weekly Water Reports''' == | ||
Revision as of 11:42, 23 March 2017
|
|
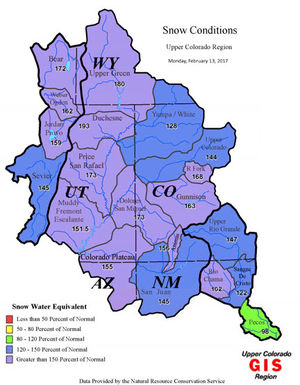
Upper Colorado River Basin HydrologyThe Upper Colorado River Basin regularly experiences significant year to year hydrologic variability. During the 17-year period 2000 to 2015, however, the unregulated inflow to Lake Powell, which is a good measure of hydrologic conditions in the Colorado River Basin, was above average in only 3 out of the past 17 years. The period 2000-2016 is the lowest 17-year period since the closure of Glen Canyon Dam in 1963, with an average unregulated inflow of 8.57 maf, or 79% of the 30-year average (1981-2010). (For comparison, the 1981-2010 total water year average is 10.83 maf.) The unregulated inflow during the 2000-2016 period has ranged from a low of 2.64 maf (24% of average) in water year 2002 to a high of 15.97 maf (147% of average) in water year 2011. In water year 2016 unregulated inflow volume to Lake Powell was 9.62 maf (89% of average), which, though still below average, was significantly higher than inflows observed in 2012 and 2013 (45% and 47% of average, respectively). Under the current most probable forecast, the total water year 2017 unregulated inflow to Lake Powell is projected to be 13.5 maf (189% of average). [1] |
| Current Status |
Current Operations | Inflow Forecasts and Model Projections |
|---|
