Difference between revisions of "Hydrology"
Cellsworth (Talk | contribs) |
Cellsworth (Talk | contribs) |
||
| Line 121: | Line 121: | ||
*[http://www.usbr.gov/uc/rm/amp/amwg/mtgs/16feb24/pdf/Attach_08.pdf AMWG: Basin Hydrology, Operations, and 2017 Hydrograph] | *[http://www.usbr.gov/uc/rm/amp/amwg/mtgs/16feb24/pdf/Attach_08.pdf AMWG: Basin Hydrology, Operations, and 2017 Hydrograph] | ||
*[http://www.usbr.gov/uc/rm/amp/twg/mtgs/16jan26/documents/Attach_02.pdf Glen Canyon Dam Operations During Equalization] | *[http://www.usbr.gov/uc/rm/amp/twg/mtgs/16jan26/documents/Attach_02.pdf Glen Canyon Dam Operations During Equalization] | ||
| + | *[https://www.usbr.gov/uc/rm/amp/twg/mtgs/16jan26/documents/AR01_Topping.pdf Project 2: Streamflow, Water Quality, Sediment Transport, and Sand Budgets in the Colorado River Ecosystem] | ||
'''2015''' | '''2015''' | ||
Revision as of 15:19, 27 March 2017
|
|
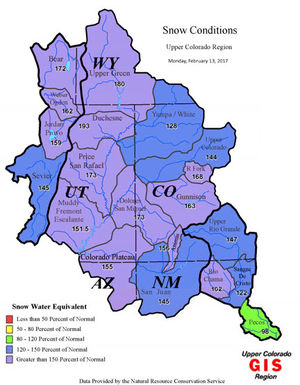
Upper Colorado River Basin HydrologyThe Upper Colorado River Basin regularly experiences significant year to year hydrologic variability. During the 17-year period 2000 to 2015, however, the unregulated inflow to Lake Powell, which is a good measure of hydrologic conditions in the Colorado River Basin, was above average in only 3 out of the past 17 years. The period 2000-2016 is the lowest 17-year period since the closure of Glen Canyon Dam in 1963, with an average unregulated inflow of 8.57 maf, or 79% of the 30-year average (1981-2010). (For comparison, the 1981-2010 total water year average is 10.83 maf.) The unregulated inflow during the 2000-2016 period has ranged from a low of 2.64 maf (24% of average) in water year 2002 to a high of 15.97 maf (147% of average) in water year 2011. In water year 2016 unregulated inflow volume to Lake Powell was 9.62 maf (89% of average), which, though still below average, was significantly higher than inflows observed in 2012 and 2013 (45% and 47% of average, respectively). Under the current most probable forecast, the total water year 2017 unregulated inflow to Lake Powell is projected to be 13.5 maf (189% of average). [1] |
| Current Status |
Current Operations | Inflow Forecasts and Model Projections |
|---|
