Difference between revisions of "Hydrology"
Cellsworth (Talk | contribs) |
Cellsworth (Talk | contribs) |
||
| (One intermediate revision by the same user not shown) | |||
| Line 84: | Line 84: | ||
== '''Inflow Volumes to Lake Powell and Release Volumes from Glen Canyon Dam''' == | == '''Inflow Volumes to Lake Powell and Release Volumes from Glen Canyon Dam''' == | ||
| − | 10-year average inflow ( | + | 10-year average inflow (2015-2024): 8.61 maf <br> |
| − | 10-year average release ( | + | 10-year average release (2015-2024): 8.45 maf <br> |
{| class="sortable wikitable" style="text-align:center;" | {| class="sortable wikitable" style="text-align:center;" | ||
| Line 93: | Line 93: | ||
!Release Volume (maf) | !Release Volume (maf) | ||
| + | |- | ||
| + | |2024||07.981||07.48|| | ||
|- | |- | ||
|2023||13.421||08.58|| | |2023||13.421||08.58|| | ||
Latest revision as of 12:37, 20 December 2024
|
|
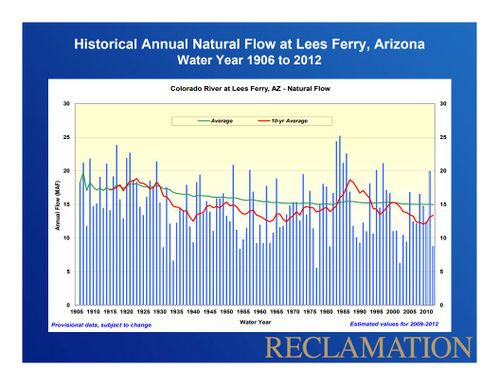
Upper Colorado River Basin HydrologyUpper Colorado River Basin regularly experiences significant year to year hydrologic variability. During the 21-year period 2000 to 2020, however, the unregulated inflow to Lake Powell, which is a good measure of hydrologic conditions in the Colorado River Basin, was above average in only 4 out of the past 19 years. The period 2000-2020 is the lowest 21-year period since the closure of Glen Canyon Dam in 1963, with an average unregulated inflow of 8.62 maf, or 80 percent of the 30-year average (1981-2010). (For comparison, the 1981-2010 total water year average is 10.83 maf.) The unregulated inflow during the 2000-2020 period has ranged from a low of 2.64 maf (24 percent of average) in water year 2002 to a high of 15.97 maf (147 percent of average) in water year 2011. In water year 2018 unregulated inflow volume to Lake Powell was 4.6 maf (43 percent of average), the third driest year on record above 2002 and 1977. [1] |
| Current Status |
Current Operations |
Inflow Forecasts and Model Projections |
|---|


