|
|
| (One intermediate revision by the same user not shown) |
| Line 126: |
Line 126: |
| | |class="MainPageBG" style="width:45%; border:1px solid #cedff2; background:#f5faff; vertical-align:top;"| | | |class="MainPageBG" style="width:45%; border:1px solid #cedff2; background:#f5faff; vertical-align:top;"| |
| | {| width="100%" cellpadding="2" cellspacing="5" style="vertical-align:top; background:#f5faff;" | | {| width="100%" cellpadding="2" cellspacing="5" style="vertical-align:top; background:#f5faff;" |
| − | ! <h2 style="margin:0; background:#cedff2; font-size:120%; font-weight:bold; border:1px solid #a3b0bf; text-align:left; color:#000; padding:0.2em 0.4em;">USBR LINKS</h2> | + | ! <h2 style="margin:0; background:#cedff2; font-size:120%; font-weight:bold; border:1px solid #a3b0bf; text-align:left; color:#000; padding:0.2em 0.4em;">News related LINKS</h2> |
| | |- | | |- |
| | |style="color:#000;"| | | |style="color:#000;"| |
| − | * | + | *[[Media:201410 NDW Article Our Water Keeping it Clean.pdf |201410 NDW Article Our Water Keeping it Clean-- Green and Blue Algae]] |
| | * | | * |
| | * | | * |
GROUP MEMBERS
|
|
|
Water Quality Links
|
- General
- GCMRC Monitoring Stations Map
[http://www.gcmrc.gov/discharge_qw_sediment/stations/GCDAMP
GCMRC Maps and Spatial Data]
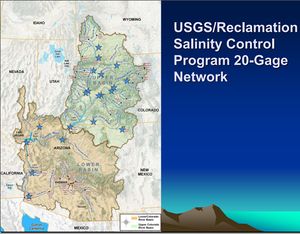
[1]
Temperature
Salinity
2011 Water quality standards for salinity
[2]
- Station ---------------- Salinity in mg/L
- Below Hoover Dam 723
- Below Parker Dam 747
- At Imperial Dam 879
Lake Mead
- Water-quality sampling in Lake Powell was initiated by the USBR in 1964 and continued through 1990.
- Glen Canyon Environmental Studies conducted the monitoring from 1990-1996.
- The USGS Water Resources Discipline conducted monitoring in Lake Powell on several dates in 1992, 1994, and 1995.
- Since 1997, monitoring has been conducted by the USGS-GCMRC.
State of the Colorado River Ecosystem in Grand Canyon- USGS Circular 1282
- "Cold water temperatures: Cold water temperatures suppress important diseases, parasites, competitors, and predators of native fish."(pg26)
- Q: How could increases in salinity levels affect Lake Mead?
A: The associated costs might be felt from homeowners in the form of increases in corrosiveness to water fixtures/ pipes and more salt needed in the water softeners.
- Q: How do concentrations of salts (salinity) in the Colorado River cause economic damages to the Lower Basin?
- [Source: SNWA-CRC] The concentrations of salts in the Colorado River cause approximately $376 million in quantified damages in the Lower Basin each year and significantly more immeasurable damages. Modeling by the USBR indicates that quantifiable damages will rise to approximately $577 million per year by 2030 without the Salinity Control Program's continuation.
- Colorado River water increases from about 50 mg/L at its headwaters to more than 700 mg/L in the Lower Basin. High salt levels in the water cause significant economic damages downstream:
- a decrease in the life of treatment facilities and pipelines in the utility sector
- a reduction in the yield of salt-sensitive crops and increased water use to meet the leaching requirements in the agricultural sector
- increased use of imported water and cost of desalination and brine disposal for recycling water in the municipal sector
- a reduction in the useful life of galvanized water pipe systems, water heaters, faucets, garbage disposals, clothes washers and dishwaters, and increased use of bottled water and water softeners in the household
- an increase in the cost of cooling operations and the cost of water softening, and a decrease in equipment service life in the commercial sector
- an increase in the use of water and the cost of water treatment, and an increase in sewer fees in the industrial sector
- difficulty in meeting wastewater discharge requirements to comply with National Pollutant Discharge Elimination System permit terms and conditions, and an increase in deslination and brine disposal costs due to accumulation of salts in groundwater basins
|
|
News related LINKS
|
|
|
Reports and Links
|
|
|
Other Stuff
|
|
|
- The river’s water quality varies as it travels through different stretches and land uses. Runoff from agriculture, abandoned mines, and naturally occurring saline ground water discharges cause localized water quality problems.
- ECONOMIC DAMAGES: (From Salinity) -- affected items include water heaters, washers, valves, faucets and the pipes themselves, and the costs of using more soap and softeners in laundry and dishwashers. Many plants are sensitive to salts around their roots, and high salinity water kills such plants.
|


