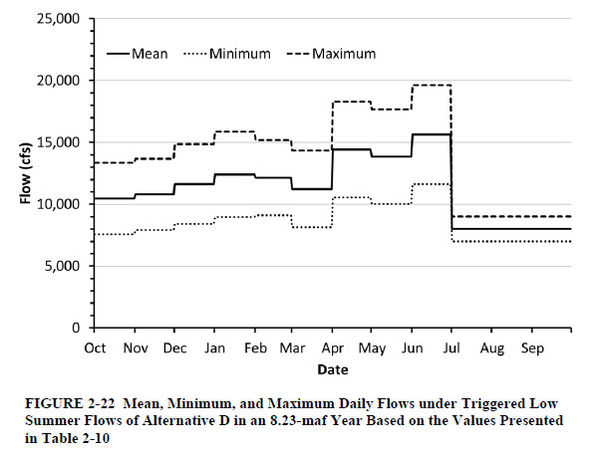
Objectives
|
|
Increase mainstem river temperature to increase humpback chub growth.
|
Trigger
|
|
Initial experiment: in the second 10 years of the LTEMP period (2026-2036) when target temperature of ≥14°C can be achieved only with low summer flow
Subsequent experimental use if:
- Initial test was successful,
- Humpback chub population concerns warrant their use,
- Water temperature appears to be limiting recruitment, and
- Target temperature of ≥14°C could be achieved only with low summer flow.
|
Offramps
|
- Low summer flows do not increase growth and recruitment of humpback chub
- Increase in warmwater nonnative species or trout at the Little Colorado River
- Longterm unacceptable adverse impacts on the resources listed in Section 1.3 are observed, or
- Sufficient warming does not occur as predicted
|
Costs and Risks
|
- desiccating the nearshore environment with the reduction in flow between June and July, and
- reducing drift with the reduction in daily fluctuation.
- Increased bioenergetic demands of humpback chub via warmer water while decreasing food supply and availability.
- Increased sediment transport during the high releases in the months prior to the LFS test in order to get the annual volume commitment to the Lower Basin.
- Increased potential for nonnative fish and parasites to proliferate throughout the Grand Canyon and impact humpback chub and other native fish populations.
- The cost to hydropower users from the 2000 Low Summer Steady Flow Experiment was estimated to be $26.4 M, which probably made it the single most expensive science experiment in US history.
| Annual volume
|
Sediment transport during normal operations
|
Sediment transport during an LSF
|
| 8.23 |
320,664 |
390,053 |
|
| 9.0 |
482,967 |
740,732 |
|
| 9.5 |
624,609 |
1,112,489 |
|
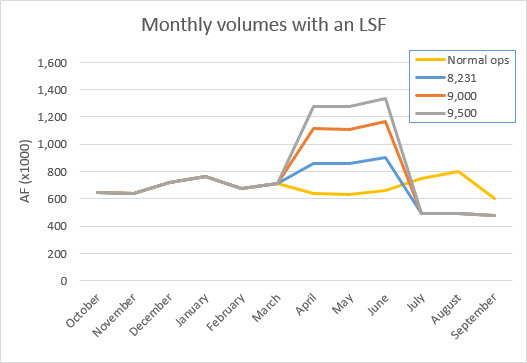
 LSF monthly volumes with various annual release volumes
|
Implementation Issues
|
- It may be difficult to model release temperatures far enough in advance to start making releases in order to meet annual release requirements.
- It may be difficult to schedule mid-year monthly releases in order to meet annual release requirements. Monthly volumes of October-December are typically pre-determined to release 2.0 MAF. Annual release volumes are typically only set after the April 1 inflow forecasts leaving April, May, and June as the only months water could be moved into from July, August, and September for the LSF.
- Short notice for science planning to monitor affects. One of the primary flaws with the 2000 Low Summer Steady Flow Experiment was that due to the short amount of time available for planning and implementation and the lack of long-term monitoring, scientists were unable to determine whether or not the experiment achieved its objectives.
|
|
Links
|
|
|
LTEMP Experimental Action: Aquatic Resource-Related Experimental Treatments (BA, pages 30-41) [1]
|
|
Low summer flows (LSF) may be tested in the second 10 years of the LTEMP period (2026-2036), for the purpose of achieving warmer river temperatures (≥14°C) to benefit
humpback chub and other native species. Under low summer flows, daily fluctuations would be less than under base operations (e.g., approximately 2,000 cfs). Investigating the anticipated effects of and options for providing warmer water temperatures in the mainstem Colorado River through Grand Canyon is an identified management action in the 2002 Humpback Chub Recovery Goals (USFWS 2002a).
It should be noted that the 2002 Humpback Chub Recovery Goals were dismissed as a result of a federal lawsuit by Grand Canyon Trust and have not yet been re-filed or supplemented. [2]
|
Papers and Publications
|
|
|
Other Stuff
|
How steady were the pre-dam flows on the Colorado River through Grand Canyon?
Page 42: These analyses indicate that, prior to the
closure of Glen Canyon Dam, the duration of flows varied
substantially over multi-year and decadal time scales.
These analyses also indicate that the discharge of the predam
river was fairly steady over sub-daily time scales, and
that the daily range in discharge was the most extreme
during the summer thunderstorm season.
Page 45: The two wettest decades, the 1920s and 1940s, had the largest
median daily ranges in discharge, 808 and 566 ft3/s,
respectively. The 1930s were the driest decade with the
lowest discharges, but had the second smallest median
daily range in discharge, 516 ft3/s. The 12-year period
from January 1, 1951, through March 12, 1963, was
slightly wetter than the 1930s, but had the smallest
median daily range in discharge, 416 ft3/s. The month
with the greatest median daily range in discharge was
June during the snowmelt flood (fig. 26 and Appendix G),
although the daily ranges in discharge were most extreme
during the summer thunderstorm season of July through
October (fig. 26). The pre-dam daily range in discharge
was largest on September 13, 1927, when discharge
increased by 68,100 ft3/s at Lees Ferry to a peak discharge
of 125,000 ft3/s as the result of a flood that mostly
originated within the San Juan River drainage basin
(fig. 21B). Although such extreme examples exist, large
daily ranges in discharge were rare during the pre-dam
era, with only 1 percent of all days having a daily
discharge range in excess of 10,000 ft3/s (fig. 27).
In addition to radically changing the
hydrology, operation of the dam for power generation has
introduced daily fluctuations in discharge that are much
larger and more common than those that generally
occurred prior to closure of the dam (figs. 21B and 25A).
|
|

