Difference between revisions of "Low Summer Flow Experiment"
Cellsworth (Talk | contribs) |
Cellsworth (Talk | contribs) |
||
| Line 133: | Line 133: | ||
|style="color:#000;"| | |style="color:#000;"| | ||
| + | ==How steady were the pre-dam flows on the Colorado River through Grand Canyon?== | ||
| + | *[https://pubs.usgs.gov/pp/pp1677/pdf/pp1677.pdf Topping et al. 2003. Computation and analysis of the instantaneous-discharge record for the Colorado River at Lees Ferry, Arizona, May 8, 1921 through September 30, 2000: U.S. Geological Survey Professional Paper 1677, 118 p.] | ||
| + | |||
| + | Page 42: These analyses indicate that, prior to the | ||
| + | closure of Glen Canyon Dam, the duration of flows varied | ||
| + | substantially over multi-year and decadal time scales. | ||
| + | These analyses also indicate that the discharge of the predam | ||
| + | river was fairly steady over sub-daily time scales, and | ||
| + | that the daily range in discharge was the most extreme | ||
| + | during the summer thunderstorm season. | ||
| + | |||
| + | Page 45: The two wettest decades, the 1920s and 1940s, had the largest | ||
| + | median daily ranges in discharge, 808 and 566 ft3/s, | ||
| + | respectively. The 1930s were the driest decade with the | ||
| + | lowest discharges, but had the second smallest median | ||
| + | daily range in discharge, 516 ft3/s. The 12-year period | ||
| + | from January 1, 1951, through March 12, 1963, was | ||
| + | slightly wetter than the 1930s, but had the smallest | ||
| + | median daily range in discharge, 416 ft3/s. The month | ||
| + | with the greatest median daily range in discharge was | ||
| + | June during the snowmelt flood (fig. 26 and Appendix G), | ||
| + | although the daily ranges in discharge were most extreme | ||
| + | during the summer thunderstorm season of July through | ||
| + | October (fig. 26). The pre-dam daily range in discharge | ||
| + | was largest on September 13, 1927, when discharge | ||
| + | increased by 68,100 ft3/s at Lees Ferry to a peak discharge | ||
| + | of 125,000 ft3/s as the result of a flood that mostly | ||
| + | originated within the San Juan River drainage basin | ||
| + | (fig. 21B). Although such extreme examples exist, large | ||
| + | daily ranges in discharge were rare during the pre-dam | ||
| + | era, with only 1 percent of all days having a daily | ||
| + | discharge range in excess of 10,000 ft3/s (fig. 27). | ||
| + | |||
| + | In addition to radically changing the | ||
| + | hydrology, operation of the dam for power generation has | ||
| + | introduced daily fluctuations in discharge that are much | ||
| + | larger and more common than those that generally | ||
| + | occurred prior to closure of the dam (figs. 21B and 25A). | ||
|} | |} | ||
Revision as of 11:08, 19 May 2017
|
|
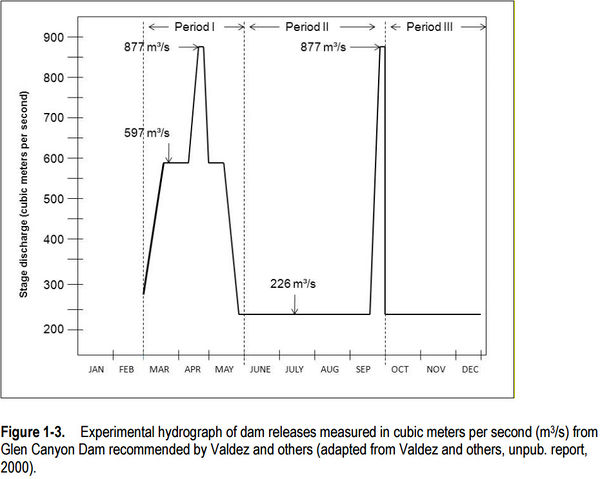
Low summer flows (minimum daily mean 5,000 to 8,000 cfs) for three months (Jul.–Sep.) to target ≥14°C at Little Colorado River confluence. The experiment would not be conducted if:
|
| --- |
--- |
--- |
|---|
|
|
