USBR Weekly Water Reports
- Reservoir inflows (forecast and observed)
- Reservoir releases
- SNOTEL
- Water use
USBR Monthly/Annual Reports
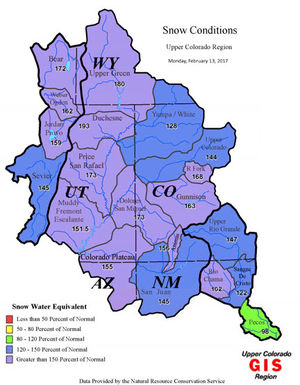
Snow Pack Reports
U.S. Drought Monitor
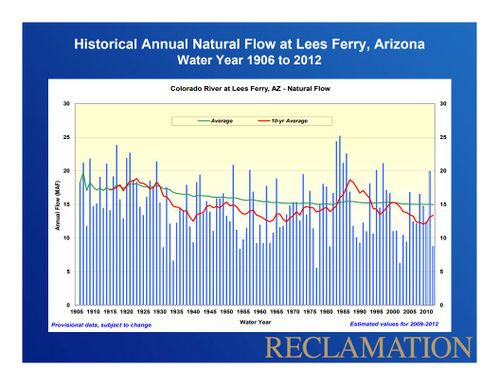
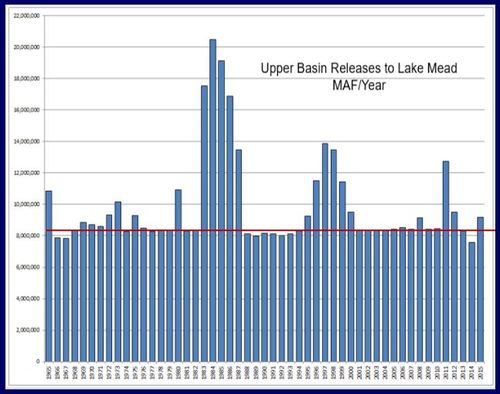
Inflow Volumes to Lake Powell and Release Volumes from Glen Canyon Dam
10-year average inflow (2014-2023): 8.8493 maf
10-year average release (2014-2023): 8.4521 maf
| Water Year
|
Unregulated Inflow (maf)
|
Release Volume (maf)
|
| 2023 |
13.421 |
08.58 |
|
| 2022 |
06.084 |
07.000 |
|
| 2021 |
03.502 |
08.230 |
|
| 2020 |
05.847 |
08.230 |
|
| 2019 |
12.951 |
09.001 |
|
| 2018 |
04.612 |
09.000 |
|
| 2017 |
11.905 |
09.000 |
|
| 2016 |
09.616 |
09.000 |
|
| 2015 |
10.174 |
09.000 |
|
| 2014 |
10.381 |
07.480 |
|
| 2013 |
05.117 |
08.232 |
|
| 2012 |
04.908 |
09.466 |
|
| 2011 |
15.971 |
12.518 |
|
| 2010 |
08.426 |
08.235 |
|
| 2009 |
10.220 |
08.236 |
|
| 2008 |
12.086 |
08.978 |
|
| 2007 |
08.754 |
08.231 |
|
| 2006 |
08.626 |
08.228 |
|
| 2005 |
12.795 |
08.232 |
|
| 2004 |
05.913 |
08.231 |
|
| 2003 |
06.161 |
08.229 |
|
| 2002 |
02.643 |
08.230 |
|
| 2001 |
06.994 |
08.236 |
|
| 2000 |
06.936 |
09.381 |
|
| 1999 |
12.800 |
11.204 |
|
| 1998 |
13.520 |
13.510 |
|
| 1997 |
17.053 |
13.824 |
|
| 1996 |
10.402 |
11.522 |
|
| 1995 |
15.905 |
09.223 |
|
| 1994 |
06.794 |
08.289 |
|
| 1993 |
14.437 |
08.102 |
|
| 1992 |
07.352 |
08.002 |
|
| 1991 |
08.801 |
08.121 |
|
| 1990 |
05.311 |
08.140 |
|
| 1989 |
05.939 |
07.981 |
|
| 1988 |
07.989 |
08.144 |
|
| 1987 |
13.377 |
13.429 |
|
| 1986 |
18.546 |
16.848 |
|
| 1985 |
17.517 |
19.094 |
|
| 1984 |
20.846 |
20.499 |
|
| 1983 |
20.371 |
17.493 |
|
| 1982 |
12.771 |
08.304 |
|
| 1981 |
05.639 |
08.295 |
|
| 1980 |
13.682 |
10.907 |
|
| 1979 |
14.189 |
08.297 |
|
| 1978 |
11.059 |
08.354 |
|
| 1977 |
03.529 |
08.260 |
|
| 1976 |
08.431 |
08.482 |
|
| 1975 |
13.095 |
09.255 |
|
| 1974 |
09.970 |
08.266 |
|
| 1973 |
15.974 |
10.108 |
|
| 1972 |
09.329 |
09.311 |
|
| 1971 |
11.798 |
08.591 |
|
| 1970 |
11.992 |
08.692 |
|
| 1969 |
11.520 |
08.823 |
|
| 1968 |
10.319 |
08.334 |
|
| 1967 |
08.979 |
07.797 |
|
| 1966 |
08.689 |
07.854 |
|
| 1965 |
15.046 |
10.820 |
|
| 1964 |
07.492 |
02.413 |
|
|
Stream Flow Gages
|
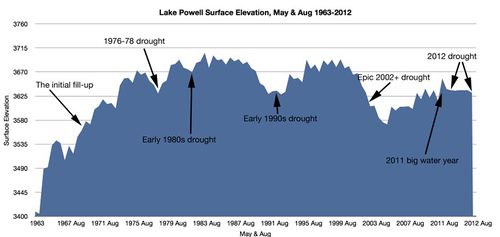
- Lake Powell Water Level Graphs
- Glen Canyon Dam releases (SCADA)
- Glen Canyon Dam releases (HDB), SDI for total release = 1872
- Water Holes Canyon above the mouth
- Colorado River at Lees Ferry
- Paria River near Kanab, UT
- Paria River at Lees Ferry, AZ
- Badger Creek below highway 89A near Vermillion Cliffs, AZ
- Tanner Wash below highway 89A near Bitter Springs, AZ
- House Rock Wash above Emmett Wash near Cliff Dwellers, AZ
- North Canyon near Cliff Dwellers, AZ
- Shinumo Wash in Twentynine Mile Canyon near Cedar Ridge, AZ
- Colorado River near river mile 30
- Colorado River above Little Colorado River near Desert View, AZ
- Moenkopi Wash at Moenkopi, AZ
- Moenkopi Wash near Cameron, AZ
- Little Colorado River at Grand Falls, AZ
- Little Colorado River near Cameron, AZ
- Little Colorado River above the mouth near Desert View, AZ
- Colorado River near Grand Canyon, AZ
- Bright Angel Creek near Grand Canyon, AZ
- Shinumo Creek
- Kanab Creek above the mouth near Supai, AZ
- Havasu Creek above the mouth near Supai, AZ
- Colorado River above National Canyon near Supai, AZ
- Colorado River above Diamond Creek near Peach Springs, AZ
- Lake Mead Water Level Graphs
|
Projects
|
|
|
Presentations and Papers
|
|
2024
2023
2022
2021
2020
2019
2018
2017
2016
2015
2014
2013
2012
2011
2010
2009
2003
|
Other Stuff
|
|
|
|


