USBR Weekly Water Reports
- Reservoir inflows (forecast and observed)
- Reservoir releases
- SNOTEL
- Water use
USBR Monthly/Annual Reports
Snow Pack Reports
U.S. Drought Monitor
Inflow Volumes to Lake Powell and Release Volumes from Glen Canyon Dam
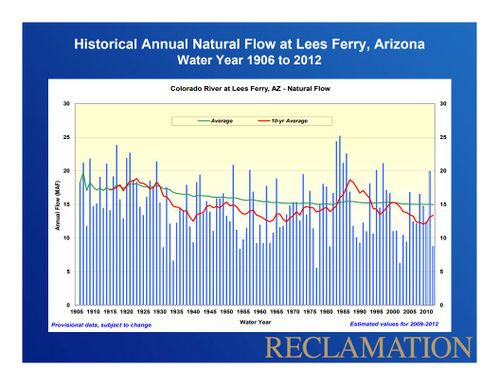
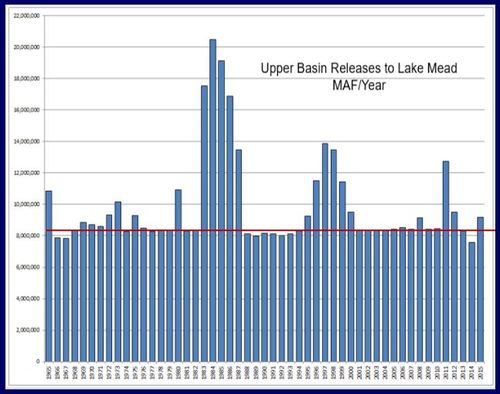
Upper Colorado River Basin regularly experiences significant year to year hydrologic variability. During the 21-year period 2000 to 2020, however, the unregulated inflow to Lake Powell, which is a good measure of hydrologic conditions in the Colorado River Basin, was above average in only 4 out of the past 19 years. The period 2000-2020 is the lowest 21-year period since the closure of Glen Canyon Dam in 1963, with an average unregulated inflow of 8.62 maf, or 80 percent of the 30-year average (1981-2010). (For comparison, the 1981-2010 total water year average is 10.83 maf.) The unregulated inflow during the 2000-2020 period has ranged from a low of 2.64 maf (24 percent of average) in water year 2002 to a high of 15.97 maf (147 percent of average) in water year 2011. [3]
Inflow and Release Volumes
| Water Year
|
Unregulated Inflow (maf)
|
Release Volume (maf)
|
| 2021 (Nov forecast) |
06.79 |
08.23 |
|
| 2020 |
05.85 |
08.23 |
|
| 2019 |
12.95 |
09.02 |
|
| 2018 |
04.62 |
09.02 |
|
| 2017 |
11.92 |
09.02 |
|
| 2016 |
09.62 |
09.00 |
|
| 2015 |
10.20 |
09.02 |
|
| 2014 |
10.40 |
07.50 |
|
| 2013 |
05.12 |
08.25 |
|
| 2012 |
04.91 |
09.47 |
|
| 2011 |
15.98 |
12.53 |
|
| 2010 |
08.43 |
08.26 |
|
| 2009 |
10.22 |
08.26 |
|
| 2008 |
12.09 |
08.98 |
|
| 2007 |
08.77 |
08.25 |
|
| 2006 |
08.65 |
08.24 |
|
| 2005 |
12.81 |
08.25 |
|
| 2004 |
05.91 |
08.23 |
|
| 2003 |
06.17 |
08.26 |
|
| 2002 |
02.64 |
08.24 |
|
| 2001 |
07.01 |
08.25 |
|
| 2000 |
06.97 |
09.38 |
|
| 1999 |
12.81 |
11.24 |
|
| 1998 |
13.57 |
13.55 |
|
| 1997 |
17.07 |
13.85 |
|
| 1996 |
10.40 |
11.52 |
|
| 1995 |
15.91 |
09.25 |
|
| 1994 |
06.80 |
08.31 |
|
| 1993 |
14.44 |
08.13 |
|
| 1992 |
07.35 |
08.00 |
|
| 1991 |
08.82 |
08.13 |
|
| 1990 |
05.31 |
08.16 |
|
| 1989 |
05.95 |
08.03 |
|
| 1988 |
08.00 |
08.14 |
|
| 1987 |
13.41 |
13.48 |
|
| 1986 |
18.56 |
16.89 |
|
| 1985 |
17.53 |
19.14 |
|
| 1984 |
20.86 |
20.50 |
|
| 1983 |
20.38 |
17.51 |
|
| 1982 |
12.78 |
08.33 |
|
| 1981 |
05.65 |
08.32 |
|
| 1980 |
13.68 |
10.91 |
|
| 1979 |
14.20 |
08.32 |
|
| 1978 |
11.07 |
08.39 |
|
| 1977 |
03.55 |
08.30 |
|
| 1976 |
08.43 |
08.48 |
|
| 1975 |
13.10 |
09.28 |
|
| 1974 |
09.98 |
08.27 |
|
| 1973 |
15.99 |
10.14 |
|
| 1972 |
09.33 |
09.31 |
|
| 1971 |
11.82 |
08.62 |
|
| 1970 |
12.01 |
08.70 |
|
| 1969 |
11.53 |
08.84 |
|
| 1968 |
10.32 |
08.33 |
|
| 1967 |
08.99 |
07.82 |
|
| 1966 |
08.72 |
07.88 |
|
| 1965 |
15.05 |
10.83 |
|
| 1964 |
07.49 |
02.41 |
|
|
Water Flow Gages
|
- Lake Powell Water Level Graphs
- Glen Canyon Dam releases (SCADA)
- Water Holes Canyon above the mouth
- Colorado River at Lees Ferry
- Paria River near Kanab, UT
- Paria River at Lees Ferry, AZ
- Badger Creek below highway 89A near Vermillion Cliffs, AZ
- Tanner Wash below highway 89A near Bitter Springs, AZ
- House Rock Wash above Emmett Wash near Cliff Dwellers, AZ
- North Canyon near Cliff Dwellers, AZ
- Shinumo Wash in Twentynine Mile Canyon near Cedar Ridge, AZ
- Colorado River near river mile 30
- Colorado River above Little Colorado River near Desert View, AZ
- Moenkopi Wash at Moenkopi, AZ
- Moenkopi Wash near Cameron, AZ
- Little Colorado River at Grand Falls, AZ
- Little Colorado River near Cameron, AZ
- Little Colorado River above the mouth near Desert View, AZ
- Colorado River near Grand Canyon, AZ
- Colorado River near Grand Canyon, AZ
- Bright Angel Creek near Grand Canyon, AZ
- Shinumo Creek
- Kanab Creek above the mouth near Supai, AZ
- Havasu Creek above the mouth near Supai, AZ
- Colorado River above National Canyon near Supai, AZ
- Colorado River above Diamond Creek near Peach Springs, AZ
- Lake Mead Water Level Graphs
|
Presentations and Papers
|
|
2020
2019
2018
2017
2016
2015
2014
2013
2012
2011
2010
2009
2003
|
Other Stuff
|
|
|
|


![[1]](/images_gcdamp_com/thumb/d/db/LakePowellelevations1963_2012.JPG/500px-LakePowellelevations1963_2012.JPG)