Difference between revisions of "GCDAMP- Vegetation Page"
From Glen Canyon Dam AMP
(add vegetation info) |
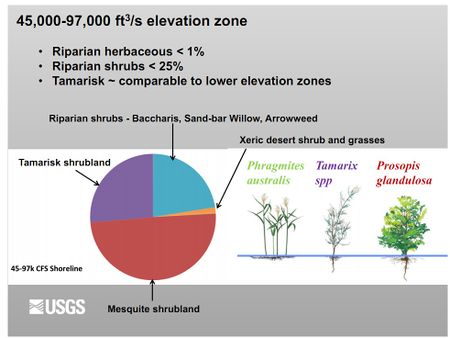
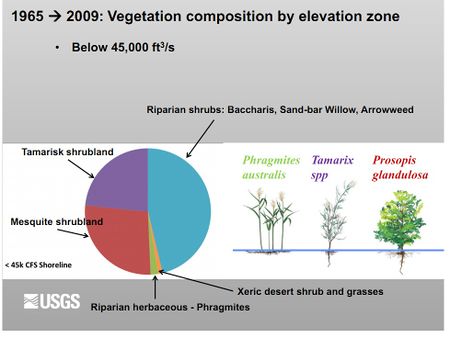
(add DIAGRAM- Vegetation comp by elevation- USGS) |
||
| Line 12: | Line 12: | ||
*Vegetation change is significantly related to river hydrology at lower elevation zones (<45k ft3/s)and regional climate at higher elevations (>97k ft3/s) | *Vegetation change is significantly related to river hydrology at lower elevation zones (<45k ft3/s)and regional climate at higher elevations (>97k ft3/s) | ||
*Remote sensing datasets allow both large-scale change detection and local-scale analysis to quantify | *Remote sensing datasets allow both large-scale change detection and local-scale analysis to quantify | ||
| + | |||
| + | ---- | ||
| + | [[File:DIAGRAM- Vegetation comp by elevation-II- USGS.jpg|450px]] | ||
| + | [[File:DIAGRAM- Vegetation comp by elevation- USGS.jpg|450px]] | ||
Revision as of 17:09, 21 May 2014
Under Construction
HFE-Workshop_USBR-SLC_100617
- Significant increase in riparian vegetation; riperian vegetation. Big floods in 1983, and has increased since then.
- 1980 infrared photos show that riparian vegetatin had taken up much of the flood plain down to power plant capacity flow levels.
- 2013 USGS Report to AMWG--
- More riparian vegetation exists than in previous 5 decades at the lowest elevation zones (<45k ft3/s)
- Riperian woody vegetation expanded shoreward
- HFEs of present magnitude/ duration do not appear to affect the longer term trend of expansion
- Vegetation change is significantly related to river hydrology at lower elevation zones (<45k ft3/s)and regional climate at higher elevations (>97k ft3/s)
- Remote sensing datasets allow both large-scale change detection and local-scale analysis to quantify

