GCDAMP Flow Type Understanding
From Glen Canyon Dam AMP
- "There is no flow that will benefit all resources." (Source: Schmidt et al. 1998 Bioscience article)
- NPS-USBR-USGS_Frequently Asked Questions- High Flow Expiriments
- Main Factors in prescribing a controlled flood release: 1. Magnitued 2. Duration 3. frequency 4. Timing
- Research Flows (RF) : Flows involving violent diurnal changes in water releases from Glen Canyon Dam, which largely prevented natural reproduction of rainbow trout but apparently did not cause low recruitments of downstream native fishes. (Like in the 1980's)
- Modified Low Fluctuating Flows (MLFF) : aimed at reducing durnal variation in flows so as to reduce sand export rates, improve flow conditions for recreational boating, and provide more hospitable flow conditions for both juvenile rainbow trout and native fishes.
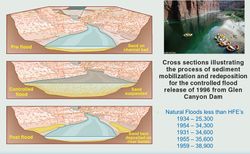
- Beach Habitat Building Flows (BHBF) : flows aimed at moving sand from the river channel and eddy environments to beach habitats. (maximum powerplant capacity plus full bypass have been called BHBFs)
- Low Summer Steady Flows (LSSF) : Flows aaimed at improving survival of juvenile native fishes in the mainstem, particularly through warming of backwater and nearshore environments of the CR mainstem (2000)
- Fall Steady Flows : flows in a fall period (September- October) thought to be critical for juvenile survival of humpback chub.
- Seasonally Adjusted Steady Flows (SASF) : Flows aimed at eliminating negative effects of diurnal flow variation on aquatic biota and providing a more natural seasonal hydrograph pattern.
- Load Following Flows (LFF) : Flows that fluctuate to respond to hydropower loads. (1980's) ecological and recreational rafting concerns.
- Fish Supression Flows : Rapid downramping of flows in summer, possibly preceded by periods of high steady flows, aimed at increasing stranding and mortality of juvenile rainbow trout in the Lees Ferry reach.
- Summer Stranding Flows: A stranding flow would maintain elevated flows (e.g., 15,000 cfs) for 2 or 3 days, followed by a very sharp drop in flows to a minimum level (i.e., 7,000 cfs). A stranding flow would be considered in the period of June, July, or August.
- Ponding Flows: Ponding flows are those relatively high flows that produce slackwater areas in tributary mouths for the benefit of humpback chub. [Source: Assessment of the Estimated Effects of Four Experimental Options on Resources Below Glen Canyon Dam- USGS_061027
High Flow Experiment
- (Source: 63rd annual report 9-30-2011_Upper Colorado River Commission)
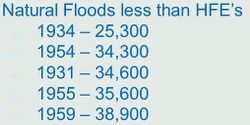
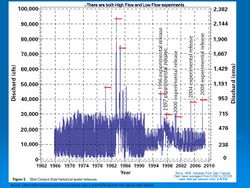
- Since the damming of the river in 1963, there has been only one flow relrease that approached average pre-dam spring floods 1983.
- Experiment HFE's have not exceeded 45,000 cfs.
HFE PROTOCOL: [Source: 2015 AMWG minutes_February]
- "These results indicates that the implementation of the HFE Protocol is causing increases in sandbar size."
- "However, it is still too early in the Protocol implementation to determine whether the repeated HFEs are resulting in a cumulative increase in sandbar size."
=== Issues/Concerns with HFE Planning Process === AMWG notes
- More oppertunity for input sooner, Modifying hydrograph from the model output, spreading of Whirling Disease, effects of flows on food base, whitewater rafting, safety concerns, monitoring of sandbars, having access to archaeological sites, and impacts to hydropower costs
- Assure that DOI's assumptions about the effects to the 2012 HFE were supported by the results when supporting data is available.
- Source: CREDA letter_2-22-2010_In the summer of 2001, experimentation cost $31 million.
- Source: Low Flows- CREDA web-site- Glen Canyon Dam “In April 2000, it was determined that due to hydrologic conditions and resulting from a 1994 USFW biological opinion, a low flow summer experiment would be undertaken. High spike flows in May and September, with low flat flows (8,000 cfs) all summer. The purpose was to gain information about HBC conditions. The low, flat flows had a severe impact on power generation, requiring WAPA to purchase replacement power on the open market in order to meet contractual obligations to the CRSP customers. The cost of the replacement power was over $22 million.
=== Use of remote digital cameras to monitor sandbar response ===
- Digital cameras now installed at 33 (out of 44) of the long-term sandbar monitoring sites.
- Each camera takes 5 photos daily to capture range of water levels and lighting conditions.
- Cameras powered by solar panels and can store photos for up to 1 year.
- Test analysis using images collected before and after 2008 HFE
- 26 sites with remote cameras (mostly film cameras)and pre- and post- HFE surveys
