Difference between revisions of "TEMPERATURE"
Cellsworth (Talk | contribs) |
Cellsworth (Talk | contribs) |
||
| (41 intermediate revisions by the same user not shown) | |||
| Line 24: | Line 24: | ||
|style="width:60%; font-size:120%;"| | |style="width:60%; font-size:120%;"| | ||
| + | == Water Temperature below Glen Canyon Dam == | ||
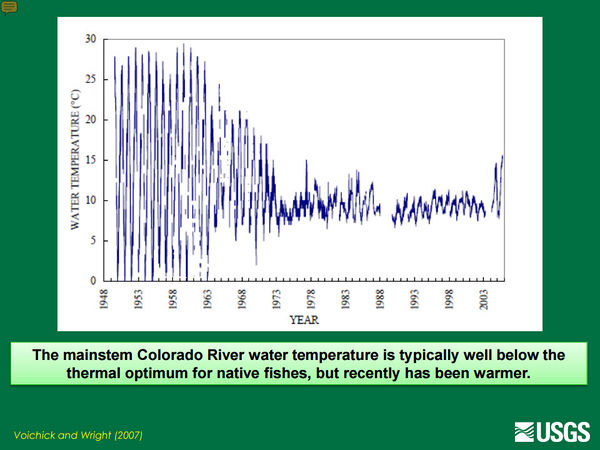
Prior to completion of Glen Canyon Dam in 1963, the temperature of water flowing through the Grand Canyon each year was highly variable, ranging from the icy, spring run-off to the warm, 85-degree summer-heated flows. However, once the dam was constructed, the temperature of the water released from the dam - drawn from the depths of Lake Powell and released through the dam's penstock intakes - ranged for many years between 45 and 50 F (7 to 10 C). With the lowering of Lake Powell, release temperatures have been increased to as high as 59 F (15 C) which has likely led to an increase in the humpback chub and other native fish populations in Grand Canyon. | Prior to completion of Glen Canyon Dam in 1963, the temperature of water flowing through the Grand Canyon each year was highly variable, ranging from the icy, spring run-off to the warm, 85-degree summer-heated flows. However, once the dam was constructed, the temperature of the water released from the dam - drawn from the depths of Lake Powell and released through the dam's penstock intakes - ranged for many years between 45 and 50 F (7 to 10 C). With the lowering of Lake Powell, release temperatures have been increased to as high as 59 F (15 C) which has likely led to an increase in the humpback chub and other native fish populations in Grand Canyon. | ||
| Line 41: | Line 42: | ||
|class="MainPageBG" style="width:55%; border:1px solid #cef2e0; background:#f5faff; vertical-align:top; color:#000;"| | |class="MainPageBG" style="width:55%; border:1px solid #cef2e0; background:#f5faff; vertical-align:top; color:#000;"| | ||
{|width="100%" cellpadding="2" cellspacing="5" style="vertical-align:top; background:#f5faff;" | {|width="100%" cellpadding="2" cellspacing="5" style="vertical-align:top; background:#f5faff;" | ||
| − | ! <h2 style="margin:0; background:#cedff2; font-size:120%; font-weight:bold; border:1px solid #a3bfb1; text-align:left; color:#000; padding:0.2em 0.4em;"> | + | ! <h2 style="margin:0; background:#cedff2; font-size:120%; font-weight:bold; border:1px solid #a3bfb1; text-align:left; color:#000; padding:0.2em 0.4em;"> Thermoclines </h2> |
|- | |- | ||
|style="color:#000;"| | |style="color:#000;"| | ||
| − | [[File: | + | [[File:Stratification.jpg|center|600px|]] |
| − | + | ||
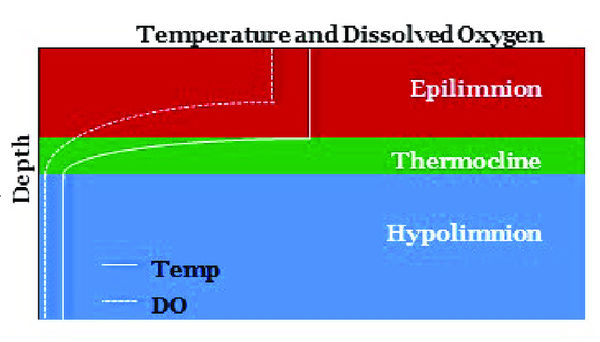
| − | + | Warm water is less dense and essentially "floats" on top of cold water. This creates a stratification of water temperatures in a reservoir with warm water at the surface and cold water near the bottom. The point in the water column where the water changes from warm to cold is called the thermocline. | |
| − | ---- | + | |- |
| + | ! <h2 style="margin:0; background:#cedff2; font-size:120%; font-weight:bold; border:1px solid #a3b0bf; text-align:left; color:#000; padding:0.2em 0.4em;"> Forebay Temperatures </h2> | ||
| + | |- | ||
| + | |style="color:#000;"| | ||
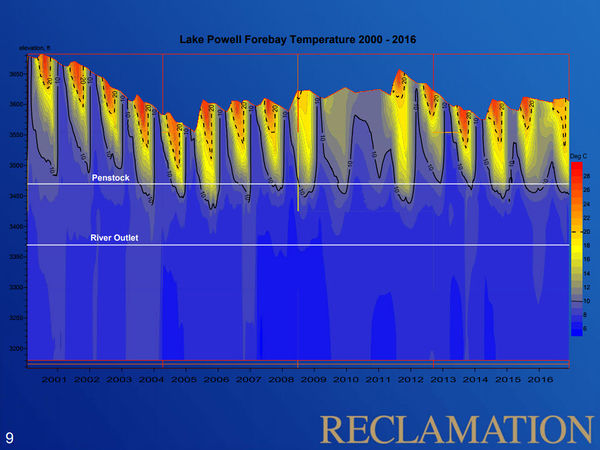
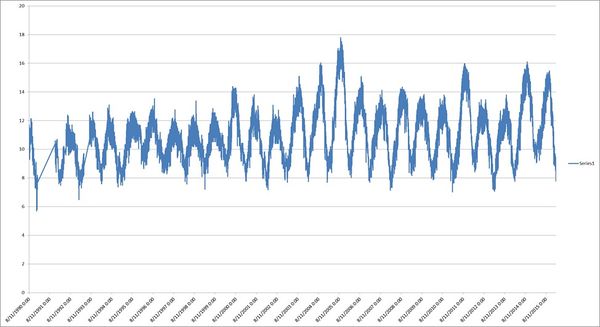
| + | [[File:ForebayTemp 2000 2016.jpg|thumb|center|600px|Forebay temperature 2000-2016; [https://www.usbr.gov/uc/rm/amp/twg/mtgs/17jan26/AR4_Radtke.pdf https://www.usbr.gov/uc/rm/amp/twg/mtgs/17jan26/AR4_Radtke.pdf] ]] | ||
| − | [[File: | + | As reservoir elevations change, the thermocline gets closer or farther away from the penstocks at Glen Canyon Dam. |
| − | + | ||
| + | |- | ||
| + | ! <h2 style="margin:0; background:#cedff2; font-size:120%; font-weight:bold; border:1px solid #a3b0bf; text-align:left; color:#000; padding:0.2em 0.4em;"> Thermoclines, Penstock Depths, and Release Temperatures </h2> | ||
| + | |- | ||
| + | |style="color:#000;"| | ||
| + | |||
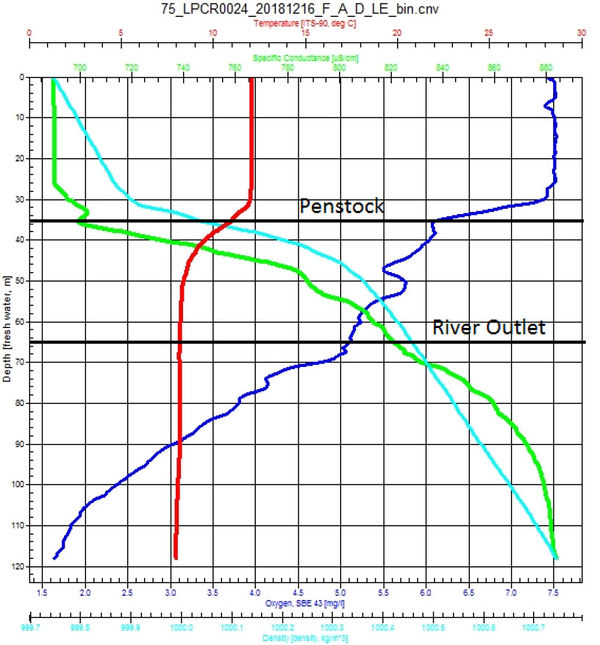
| + | [[File:Dec 2019 Penstock Thermocline.jpg|thumb|center|600px|December 2018 Operations Call]]<br> | ||
| + | |||
| + | As the penstocks begin to draw from above the thermocline, release temperatures can increase drastically. | ||
| + | |||
| + | [[File:Dec 2019 Projected Release Temps.jpg|thumb|center|600px|December 2018 Operations Call]]<br> | ||
| + | |||
| + | |- | ||
| + | ! <h2 style="margin:0; background:#cedff2; font-size:120%; font-weight:bold; border:1px solid #a3b0bf; text-align:left; color:#000; padding:0.2em 0.4em;"> Downstream Warming </h2> | ||
| + | |- | ||
| + | |style="color:#000;"| | ||
| + | |||
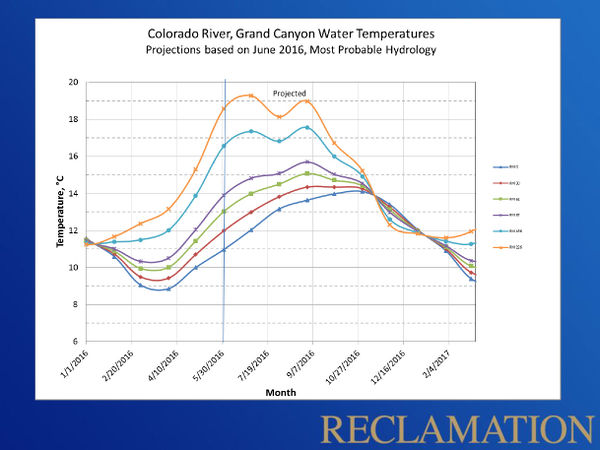
| + | The timing of seasonally warm release temperatures and high summer air temperatures have a large influence on downstream river temperatures. The warmest release temperatures occur in late October/early November but the greatest potential of warming the river in Grand Canyon occurs in July and September when air temperatures are the hottest. The reason is that it takes a lot longer to warm all the water in Lake Powell vs the water in the river as it flows downstream through the canyon. | ||
| + | |||
| + | Another thing to note that during the winter, river temperatures actually cool with distance downstream because releases are actually warmer than ambient air temperatures. | ||
| + | |||
| + | [[File:2016 ModeledRiverTemps.jpg|thumb|center|600px|June 2016 Operations Call]]<br> | ||
|} | |} | ||
| Line 68: | Line 93: | ||
|style="color:#000;"| | |style="color:#000;"| | ||
| + | *[http://gcdamp.com/index.php?title=GCDAMP_Temperature_Learning_Page Temperature Learning Page] | ||
| + | *[http://gcdamp.com/index.php?title=TCD_Learning_Page TCD Learning Page] | ||
| + | *[http://gcdamp.com/index.php?title=Nonnative_Invasive_Aquatic_Species Nonnative Fish Page] | ||
| + | *[http://gcdamp.com/index.php?title=Bioenergetics_Studies Bioenergetics Page] | ||
*[[Near Shore Ecology (NSE) Study]] of the fall steady flow test | *[[Near Shore Ecology (NSE) Study]] of the fall steady flow test | ||
| − | *[http://gcdamp.com/index.php?title=Low_Summer_Flow_Experiment The Low | + | *[http://gcdamp.com/index.php?title=Low_Summer_Flow_Experiment The Low Summer Flow Experiment (LSF) Page] |
| − | + | ||
| − | + | ||
| − | + | ||
|- | |- | ||
| Line 79: | Line 105: | ||
|style="color:#000;"| | |style="color:#000;"| | ||
| + | *[https://tableau.usgs.gov/views/colorado-river-water-quality-gcd/GlenCanyonDamSiteHourlyAverages?%3Aembed=y&%3AisGuestRedirectFromVizportal=y Glen Canyon Dam Site: Hourly Averages] | ||
| + | *[https://www.gcmrc.gov/discharge_qw_sediment/station/GCDAMP/09379901 Glen Canyon Dam near Page, AZ] | ||
| + | *[https://www.gcmrc.gov/discharge_qw_sediment/station/GCDAMP/09382000 Paria River at Lees Ferry, AZ] | ||
*[http://www.gcmrc.gov/discharge_qw_sediment/station/GCDAMP/09380000 Colorado River at Lees Ferry] | *[http://www.gcmrc.gov/discharge_qw_sediment/station/GCDAMP/09380000 Colorado River at Lees Ferry] | ||
| − | *[http://www.gcmrc.gov/discharge_qw_sediment/station/GCDAMP/09383050 Colorado River | + | *[http://www.gcmrc.gov/discharge_qw_sediment/station/GCDAMP/09383050 Colorado River near river mile 30] |
| − | *[http://www.gcmrc.gov/discharge_qw_sediment/station/GCDAMP/09383100 Colorado River above | + | *[http://www.gcmrc.gov/discharge_qw_sediment/station/GCDAMP/09383100 Colorado River above Little Colorado River near Desert View, AZ] |
| − | *[ | + | *[https://www.gcmrc.gov/discharge_qw_sediment/station/GCDAMP/09402300 Little Colorado River above the mouth near Desert View, AZ] |
| − | *[http://www.gcmrc.gov/discharge_qw_sediment/station/GCDAMP/09403000 Bright Angel Creek] | + | *[https://www.gcmrc.gov/discharge_qw_sediment/station/GCDAMP/09402500 Colorado River near Grand Canyon, AZ] |
| + | *[http://www.gcmrc.gov/discharge_qw_sediment/station/GCDAMP/09403000 Bright Angel Creek near Grand Canyon, AZ] | ||
*[http://www.gcmrc.gov/discharge_qw_sediment/station/GCDAMP/09402352 Colorado River abv Lava Canyon rm66] | *[http://www.gcmrc.gov/discharge_qw_sediment/station/GCDAMP/09402352 Colorado River abv Lava Canyon rm66] | ||
*[http://www.gcmrc.gov/discharge_qw_sediment/station/GCDAMP/09403270 Colorado River bl rm127] | *[http://www.gcmrc.gov/discharge_qw_sediment/station/GCDAMP/09403270 Colorado River bl rm127] | ||
| − | *[http://www.gcmrc.gov/discharge_qw_sediment/station/GCDAMP/09403850 Kanab Creek] | + | *[http://www.gcmrc.gov/discharge_qw_sediment/station/GCDAMP/09403850 Kanab Creek above the mouth near Supai, AZ] |
| − | *[http://www.gcmrc.gov/discharge_qw_sediment/station/GCDAMP/09404115 Havasu Creek] | + | *[http://www.gcmrc.gov/discharge_qw_sediment/station/GCDAMP/09404115 Havasu Creek above the mouth near Supai, AZ] |
| − | *[http://www.gcmrc.gov/discharge_qw_sediment/station/GCDAMP/09404120 Colorado River | + | *[http://www.gcmrc.gov/discharge_qw_sediment/station/GCDAMP/09404120 Colorado River above National Canyon near Supai, AZ] |
| − | *[http://www.gcmrc.gov/discharge_qw_sediment/station/GCDAMP/09404200 Colorado River | + | *[http://www.gcmrc.gov/discharge_qw_sediment/station/GCDAMP/09404200 Colorado River above Diamond Creek near Peach Springs, AZ] |
| − | *[http://www.gcmrc.gov/discharge_qw_sediment/station/GCDAMP/09404220 Colorado River | + | *[http://www.gcmrc.gov/discharge_qw_sediment/station/GCDAMP/09404220 Colorado River above Spencer Creek at river mile 246] |
|- | |- | ||
| Line 96: | Line 126: | ||
|- | |- | ||
|style="color:#000;"| | |style="color:#000;"| | ||
| + | |||
| + | '''2022''' | ||
| + | *[https://www.paysonroundup.com/news/arizona_state/low-water-levels-at-lake-powell-impact-the-fish-downstream/article_9cff5e91-04e0-5147-9a3d-8eccbbb496b5.html?utm_medium=social&utm_source=email&utm_campaign=user-share Low water levels at Lake Powell impact the fish downstream] | ||
| + | *[https://www.usbr.gov/uc/progact/amp/amwg/2022-02-10-amwg-meeting/20220210-FY2022DroughtFundingInfrastructureAlternatives-508-UCRO.pdf FY 2022 Drought Funding: Infrastructure Alternatives ] | ||
| + | *[https://www.usbr.gov/uc/progact/amp/twg/2022-01-13-twg-meeting/20220113-TWGMeeting-BasinHydrologyOperationsWaterQuality-508-UCRO.pdf Basin Hydrology, Operations and Water Quality ] | ||
| + | |||
| + | '''2021''' | ||
| + | *[https://www.usbr.gov/uc/progact/amp/twg/2021-10-14-twg-meeting/20211014-GlenCanyonDamReleaseTemperatures-Presentation-508-UCRO.pdf Glen Canyon Dam Release Temperatures] | ||
| + | *[https://www.usbr.gov/uc/progact/amp/twg/2021-06-17-twg-meeting/20210617-TemperatureControlFishPassageGlenCanyonDam%E2%80%93RecentProgress-508-UCRO.pdf Temperature Control and Fish Passage at Glen Canyon Dam – Recent Progress ] | ||
| + | |||
| + | '''2020''' | ||
| + | *[https://agupubs.onlinelibrary.wiley.com/doi/10.1029/2020WR027566 Mihalevich eta al, 2020, Water temperature controls for regulated canyon‐bound rivers: Water Resources Research] | ||
| + | *[https://www.usbr.gov/uc/progact/amp/amwg/2020-02-12-amwg-meeting/20200212-GCMRC2020AnnualReportingMeeting-PresentationPart2b-508-UCRO.pdf GCMRC 2019 Annual Reporting Meeting Overview – Part 2b ] | ||
| + | *[https://www.usbr.gov/uc/progact/amp/twg/2020-01-13-twg-meeting/20200113-AnnualReportingMeeting-PotentialImplicationsWarmerFutureColoradoRiverEcosystem-508-UCRO.pdf Potential implications of a warmer future for the Colorado River ecosystem ] | ||
| + | |||
| + | '''2018''' | ||
| + | *[https://www.usbr.gov/uc/progact/amp/twg/2018-10-10-twg-meeting/Attach_01.pdf Temperature Control Device Update PPT] | ||
| + | *[https://doi.org/10.1007/s10641-018-0774-7 Dibble et al., 2018, Warm water temperatures and shifts in seasonality increase trout recruitment but only moderately decrease adult size in western North American tailwaters: Environmental Biology of Fishes] | ||
| + | *[https://www.usbr.gov/uc/progact/amp/twg/2018-01-25-twg-meeting/AR11.pdf Temperature and nutrients as ecosystem drivers in the Colorado River PPT, Lake Powell as a regulator of temperature and Lake Powell as a regulator of nutrients PPT] | ||
'''2017''' | '''2017''' | ||
| − | *[[Media: | + | *[https://www.usbr.gov/uc/progact/amp/twg/2017-01-26-twg-meeting/AR4_Radtke.pdf Water Quality in Lake Powell and Its Influence on the Colorado River Below Glen Canyon Dam PPT] |
| + | *[https://digitalcommons.usu.edu/cgi/viewcontent.cgi?article=1951&context=wats_facpub Pine et al. 2017. Growth of Endangered Humpback Chub in Relation to Temperature and Discharge in the Lower Colorado River. USU Watershed Sciences Faculty Publications] | ||
| + | |||
| + | '''2015''' | ||
| + | *[[Media:2015 Valdez Benefits and Risks of Temperature 10062015.pdf| Benefits and Risks of Temperature Modification at Glen Canyon Dam to Fishes of the Colorado River through the Grand Canyon ppt]] | ||
'''2013''' | '''2013''' | ||
| + | *[[Media:GCD-Temp Mod-Valdez & Speas 9-17-2013.pdf| Valdez et al. 2013. Benefits and risks of temperature modification at Glen Canyon Dam to aquatic resources of the Colorado River in Grand Canyon. U.S. Bureau of Reclamation, Upper Colorado Region, Salt Lake City, UT.]] | ||
| + | *[http://pubs.usgs.gov/of/2013/1013/ Ross et al., 2013, Nearshore thermal gradients of the Colorado River near the Little Colorado River confluence, Grand Canyon National Park, Arizona, 2010: U.S. Geological Survey Open-File Report] | ||
*[https://pubs.usgs.gov/fs/2013/3104/pdf/fs2013-3104.pdf Nearshore Temperature Findings for the Colorado River in Grand Canyon, Arizona—Possible Implications for Native Fish] | *[https://pubs.usgs.gov/fs/2013/3104/pdf/fs2013-3104.pdf Nearshore Temperature Findings for the Colorado River in Grand Canyon, Arizona—Possible Implications for Native Fish] | ||
*[https://www.usbr.gov/uc/rm/amp/twg/mtgs/13jan24/Attach_07b.pdf Results of Early Temperature Analyses of the Long-Term Experimental and Management Plan EIS] | *[https://www.usbr.gov/uc/rm/amp/twg/mtgs/13jan24/Attach_07b.pdf Results of Early Temperature Analyses of the Long-Term Experimental and Management Plan EIS] | ||
| Line 106: | Line 161: | ||
'''2012''' | '''2012''' | ||
| + | *[[Media:2012 LTEMP-DOI Meet-Temp-Valdez.pdf| Temperature Considerations in the RTCD alternative for LTEMP]] | ||
*[https://www.gcmrc.gov/about/ka/KA%202%20-%2010-19-11/AM%20Talks/Grams%20Flow%20Temp%20Turbidity.pdf Flow Temp Turbidity ] | *[https://www.gcmrc.gov/about/ka/KA%202%20-%2010-19-11/AM%20Talks/Grams%20Flow%20Temp%20Turbidity.pdf Flow Temp Turbidity ] | ||
*[https://www.gcmrc.gov/about/ka/KA%202%20-%2010-19-11/PM%20Talks/Ward%20-%20Effects%20of%20temperature%20on%20native%20fish.pdf Effects of Temperature on Native Fish ] | *[https://www.gcmrc.gov/about/ka/KA%202%20-%2010-19-11/PM%20Talks/Ward%20-%20Effects%20of%20temperature%20on%20native%20fish.pdf Effects of Temperature on Native Fish ] | ||
'''2010''' | '''2010''' | ||
| − | + | *[https://www.usbr.gov/uc/progact/amp/twg/2010-11-15-twg-meeting/Attach_13.pdf Incorporating thermal regimes into environmental flows assessments: modifying dam operations to restore freshwater ecosystem integrity by Julian D. Olden and Robert J. Naiman (University of Washington, Seattle)] | |
| − | *[https://www.usbr.gov/uc/ | + | *[https://www.usbr.gov/uc/progact/amp/amwg/2010-08-24-amwg-meeting/Attach_12a.pdf Selective withdrawal and sediment augmentation update] |
| − | *[https://www.usbr.gov/uc/ | + | *[https://www.usbr.gov/uc/progact/amp/amwg/2010-08-24-amwg-meeting/Attach_12a.pdf Temperature Control Device and Sediment Augmentation Report] |
| − | *[https://www.usbr.gov/uc/ | + | *[https://www.usbr.gov/uc/progact/amp/amwg/2010-08-24-amwg-meeting/Attach_12b.pdf TWG Chair Temperature Control Device/Sediment Augmentation] |
| + | *[https://www.usbr.gov/uc/progact/amp/twg/2010-03-15-twg-meeting/Attach_07.pdf Sediment and Temperature Modeling Update PPT as presented at January 2010 Annual Reporting Meeting] | ||
| + | *[https://www.usbr.gov/uc/progact/amp/twg/2010-01-21-twg-meeting/Attach_07.pdf Temperature Control Device and Sediment Augmentation and PPT] | ||
| + | |||
| + | '''2009''' | ||
| + | *[https://www.usbr.gov/uc/progact/amp/twg/2009-09-29-twg-meeting/Attach_14.pdf Selective Withdrawal and Sediment Augmentation Update PPT] | ||
| + | *[https://www.usbr.gov/uc/progact/amp/twg/2009-09-29-twg-meeting/Attach_06.pdf Grand Canyon Monitoring and Research Center Updates] | ||
| + | *[https://www.usbr.gov/uc/progact/amp/amwg/2009-04-29-amwg-meeting/Attach_03a.pdf Grand Canyon Monitoring and Research Center (GCMRC) Update] | ||
| + | |||
| + | '''2008''' | ||
| + | *[https://www.usbr.gov/tsc/techreferences/hydraulics_lab/pubs/PAP/PAP-0972.pdf The Glen Canyon Dam temperature control device: restoring downstream habitat for endangered fish recovery] | ||
| + | *[https://www.usbr.gov/uc/progact/amp/twg/2008-04-08-twg-meeting/Attach_05g.pdf Anderson and Wright. 2007. Development and application of a water temperature model for the Colorado River below Glen Canyon Dam, Arizona. Hydrological Science and Technology, V 23, No 1-4. ] | ||
'''2007''' | '''2007''' | ||
| − | *[ | + | *[http://www.riversimulator.org/Resources/USBR/LTEP/ValdezTCDra2007.pdf Valdez and Speas. 2007. A Risk Assessment Model To Evaluate Risks and Benefits to Aquatic Resources From A Selective Withdrawal Structure On Glen Canyon Dam ] |
| + | |||
| + | '''1999''' | ||
| + | *[http://www.nativefishlab.net/library/textpdf/11454.pdf Glen Canyon Dam Modifications to Control Downstream Temperatures, Plan and Draft Environmental Assessment] | ||
|- | |- | ||
| Line 123: | Line 193: | ||
|style="color:#000;"| | |style="color:#000;"| | ||
| + | Fish occupying warmer water have higher metabolic demands than individuals in cooler water, and if these demands increase concurrently with a seasonal decline in prey availability, then growth rates and condition may be reduced. [http://wec.ufl.edu/floridarivers/NSE/Finch%20RRA%20HBC%20Growth%20NSE.pdf] | ||
| + | |||
| + | [[File:Temperature bl LCR 1990 2015.jpg|thumb|center|600px|Water Temperatures at the Little Colorado River Confluence (RM 61), 1990-2015]]<br> | ||
|} | |} | ||
Latest revision as of 10:44, 10 August 2023
|
|
Water Temperature below Glen Canyon DamPrior to completion of Glen Canyon Dam in 1963, the temperature of water flowing through the Grand Canyon each year was highly variable, ranging from the icy, spring run-off to the warm, 85-degree summer-heated flows. However, once the dam was constructed, the temperature of the water released from the dam - drawn from the depths of Lake Powell and released through the dam's penstock intakes - ranged for many years between 45 and 50 F (7 to 10 C). With the lowering of Lake Powell, release temperatures have been increased to as high as 59 F (15 C) which has likely led to an increase in the humpback chub and other native fish populations in Grand Canyon. These increases in temperature, however, also increase the risk of expanding the distribution and abundance of cool/warm-water nonnative fish like brown trout, green sunfish, smallmouth bass, and walleye which could have a devastating impact on the humpback chub population in Grand Canyon like they have on humpback chub and other native fish populations in the Upper Basin. |
| --- |
--- |
--- |
|---|
