Updates
|
Glen Canyon Monthly Operational Call
Archived Glen Canyon Monthly Operations Call slides
USBR Monthly/Annual Reports
Report to Congress Regarding Operations of Glen Canyon Dam[1]
|
The Relationship Between Reclamation and Western Regarding Operating Glen Canyon
|
|
Reclamation’s Upper Colorado Region Water Office makes monthly water release schedules in acre-feet for Glen Canyon based upon anticipated inflows to the lake, release requirements to the lower basin and storage targets for the lake. This monthly water schedule is passed on to Western’s Resource Scheduling Office in Montrose, CO. Western’s scheduling office then develops an hourly release schedule. This schedule takes into account Glen Canyon ROD requirements and the requirements and agreements made by Western and Reclamation regarding the operation of the other CRSP powerplants. Western’s dispatch office in Phoenix, Arizona then provides Reclamation’s Glen Canyon Power Operations Center with a daily, 24 hour operating schedule, identifying Western’s desired hourly electric power schedule (in megawatts). This schedule is then put into the computer system at Glen Canyon by Reclamation (2). This schedule then becomes the megawatt quantities which are targeted during the “real time” operation at Glen Canyon Dam.
The Glen Canyon Power Operations Center operators utilize the generation schedule supplied by Western to operate the generating units while giving consideration to efficiency and equipment characteristics. In addition, the generators automatically respond to a “regulation signal” developed and electronically transmitted to the dam by Western for continuous response to power system load and frequency changes. (This is further described later in this paper). [2]
|
Recent History of the "Flexibility" Within Operation Constraints
|
|
Shortly after Interim Flows began (August , 1991), Western met with staff at the Glen Canyon Environmental Studies (GCES) and with other Reclamation representatives. Western requested flexibility in order to regulate an electrical control area. This resulted in an agreement whereby Western was allowed to fluctuate 10% around any operational constraint and that Western would meet with GCES staff monthly to discuss any operational issues that surfaced. Thus, the Interim Flow downramp requirement of 1,500 cfs could be as high as 1,650 cfs and still be in compliance (1,500 cfs + 150 cfs).
After the ROD and Operating Criteria were signed, Western and Reclamation negotiated a MOU to more fully detail operational issues. Reclamation was interested in changing the 10% band width because it believed that the ROD and Operating Criteria didn’t specify that kind of flexibility. Instead, Western was allowed to use up to 1,000 cfs for regulation purposes. Compliance was to be monitored by SCADA using a one hour integrated value. It was thought that, even though a downramp at any one moment of time could be as high as 2,500 cfs (1,500 cfs + 1,000 cfs), it would be uncommon for the downramp to exceed 1,500 cfs since this is recorded as an integrated value over the hour. [3]
|
Emergency Exception Criteria vs the Regulation of an Electrical Control Area
|
|
The EIS identified Emergency Exception Criteria as common elements in all alternatives. They are defined in the EIS as follows (3):
“Normal operations described under any alternative would be altered temporarily to respond to emergencies. NERC has established guidelines for the emergency operations of interconnected power systems. . . . Examples of system emergencies include:
- Insufficient generating capacity
- Transmission system: overload, voltage control, and frequency
- System restoration
- Humanitarian situations (search and rescue)”
When emergency exception criteria are invoked, normal operations are suspended until the emergency has ended, or Western has discharged its North American Energy Reliability Council (NERC) responsibility regarding the emergency. Emergency exception criteria are further defined in the operating criteria and in the MOU on Glen Canyon operations signed by Western and Reclamation.
It was the invocation of emergency exception criteria on April 1st, 1998 which piqued the interest of some AMWG members in Reclamation and Western’s interpretation of the ROD.[4]
|
Emergency Exception Criteria vs. Regulation
|
|
Both emergency exception criteria and regulation have been described in this paper. Recently, some members of the AMWG and TWG have focused their concerns and discussion on “emergencies”. However, the issue at hand and the subject of this paper is regulation. It is largely regulation that has resulted in the occasional exceedence of the 1,500 cfs downramp.[5]
|
Policy Conclusions by Reclamation and Western
|
|
It does not seem reasonable that the ROD was intended to require either: 1) the exclusion of Glen Canyon Dam from participating in regulating a load control area, or 2) participation in regulating a load control area but limiting hourly load following to 500 cfs downramp (or something like it). Further, the environmental impact of regulation appears to be minimal, based on a review of the flows at the Lee Ferry gage. Finally, it has become clear to Reclamation and Western that precise and inviolate control of water releases from Glen Canyon Dam is beyond the capabilities of the machinery and electronic controls. For these reasons, Reclamation and Western intend to impose the following changes:
- Limit scheduled down ramps to 1,450 cfs (rather than 1,500),
- Employ the use of SCADA table in the preparation of Western’s hourly schedules,
- Investigate the transfer of a portion of the “ACE” to other CRSP powerplants,
- Move the ACE signal back to Glen Canyon Dam (i.e. return “regulation” to the dam) once it has been demonstrated that the ACE will not cause “routine” excedences,
- Work with the AMWG to determine the proper level of analysis required to address the potential downstream impacts of regulation in Glen and Grand Canyons,
- Educate all interested parties on the power system and equipment operations and the associated results to water releases at the dam,
- Add release data to Western’s web site and provide periodic reports to the TWG on the operation of Glen Canyon Dam and,
- Continue efforts to for better coordination between Reclamation and Western regarding the scheduling and operation of Glen Canyon Dam.[6]
|
|
Links and Information
|
|
|
Presentations and Papers
|
|
2023
2022
2021
2020
2019
2018
2017
2016
2015
2014
2013
2012
2011
2010
2009
2006
2004
2003
|
Operations under MLFF [7]
|
|
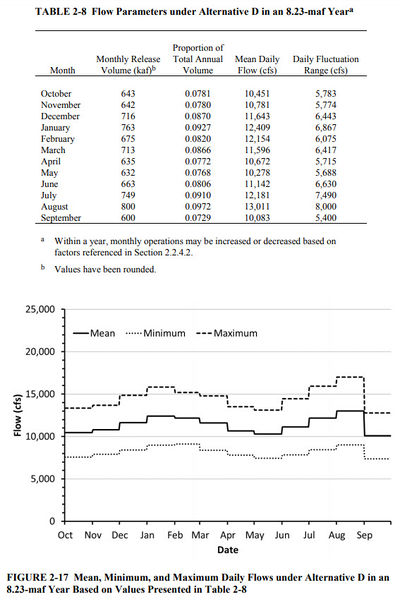
Minimum flows:
- 8,000 cfs between 7 a.m. and 7 p.m.
- 5,000 cfs between 7 p.m. and 7 a.m.
Maximum non-experimental flows:
Daily range:
- 5,000 for monthly volumes <600 kaf
- 6,000 for monthly volumes 600– 800 kaf
- 8,000 for monthly volumes >800 kaf
Ramp rates:
- 4,000 cfs/hr up
- 1,500 cfs/hr down
|
Other Stuff
|
How much water can be released at Glen Canyon Dam?
- 8 generators = 4,000 cfs each = 32,000 cfs
(note that there is usually one or two generators down for maintenance at any given time)
- 4 bypass tubes = 3,750 cfs each = 15,000 cfs
- 2 spillways = up to 208,000 cfs [8]
Critical water elevations
- 3715' = dam crest elevation
- 3700' = top of spillway gates (3704' with plywood flashboards)
- 3648' = spillway crest elevation
- 3490' = minimum power pool (to prevent cavitation in the penstocks)
- 3470' = penstock elevation (this is the centerline elevation, the penstocks are 15' in diameter)
- 3374' = bypass tube elevation (this is the centerline elevation, the bypass tubes are 8' in diameter)
- 3370' = reservoir deadpool elevation [9]
How fast do water and waves flow down the Grand Canyon?
Discharge waves move downstream faster than the water. For example, in May 1991, the discharge waves produced by rapidly changing dam releases moved through the canyon in about 1 2/3 days, whereas the water took about 4 1/3 days to travel the 235 miles from Lees Ferry to Gneiss Canyon.
Video of the construction of Glen Canyon Dam
1983 flood videos and spillway repairs
|
|


