Difference between revisions of "GCDAMP- HFE 2014"
From Glen Canyon Dam AMP
Cellsworth (Talk | contribs) |
Cellsworth (Talk | contribs) |
||
| (11 intermediate revisions by the same user not shown) | |||
| Line 17: | Line 17: | ||
== 2014 High Flow Experiment Snapshot == | == 2014 High Flow Experiment Snapshot == | ||
*The 2014 HFE represents the '''3rd''' controlled high flow release conducted under the [http://gcdamp.com/index.php?title=The_HFE_Page HFE Protocol]. | *The 2014 HFE represents the '''3rd''' controlled high flow release conducted under the [http://gcdamp.com/index.php?title=The_HFE_Page HFE Protocol]. | ||
| + | A preliminary analysis of these images indicates that sandbar size increased at 57% of sites, remained unchanged and 31% of sites, and decreased at 12% of sites, a response similar to those observed during each of the 2012-2013 HFEs. | ||
*Before and after images from the November 2014 HFE from each of the 45 sandbar sites monitored with remotely deployed digital cameras are available [https://grandcanyon.usgs.gov/gisapps/sandbartour2014/index.html? '''here''']. | *Before and after images from the November 2014 HFE from each of the 45 sandbar sites monitored with remotely deployed digital cameras are available [https://grandcanyon.usgs.gov/gisapps/sandbartour2014/index.html? '''here''']. | ||
| + | ==Sediment Conditions== | ||
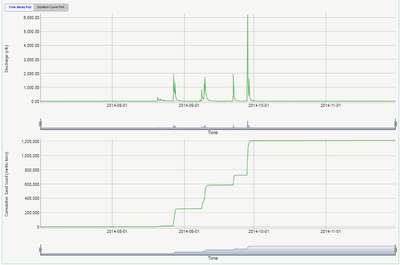
| + | '''Fall Accounting Period''' [[File:2014 FallHFE Paria.png|thumb|right|400px|[http://www.gcmrc.gov/discharge_qw_sediment/station/GCDAMP/09382000#/ '''Paria River gage at Lees Ferry'''] ]] | ||
| + | *Paria input (Jul 1 - Nov 9): 1,213,000 | ||
| + | *Accumulated in Upper Marble Canyon (Jul 1 - Nov 9, lower bound) = 815,000 | ||
| + | *Accumulated in Lower Marble Canyon (Jul 1 - Nov 9, lower bound) = 239,000 | ||
| + | *Available for HFE: 815,000 + 239,000 = 1,054,000 | ||
| + | |||
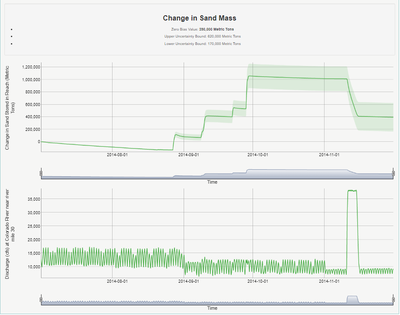
| + | '''HFE Transport''' [[File:2014 FallHFE UpperMarbleCanyon.png|thumb|right|400px|[http://www.gcmrc.gov/discharge_qw_sediment/reach/GCDAMP/09380000/09383050 '''Upper Marble Canyon'''] ]] | ||
| + | *Paria input (Nov 10 - 15): 0 | ||
| + | *Evacuated from Upper Marble Canyon (Nov 10 - 15, lower bound) = -631,000 | ||
| + | *Evacuated from Lower Marble Canyon (Nov 10 - 15, lower bound) = -37,000 | ||
| + | *Left over in Marble Canyon after HFE (Nov 10 - 15): 1,054,000 - 631,000 - 37,000 = 386,000 | ||
| + | |||
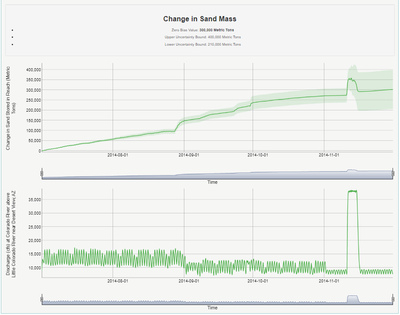
| + | '''Spring Accounting Period''' [[File:2014 FallHFE LowerMarbleCanyon.png|thumb|right|400px|[http://www.gcmrc.gov/discharge_qw_sediment/reach/GCDAMP/09383050/09383100 '''Lower Marble Canyon'''] ]] | ||
| + | *Paria input (Dec 1 to Apr 1): 13,000 | ||
| + | *Evacuated from Upper Marble Canyon (Dec 1 to Apr 1, lower bound) = -229,000 | ||
| + | *Accumulated in Lower Marble Canyon (Dec 1 to Apr 1, lower bound) = 83,000 | ||
| + | *Available for spring HFE: -229,000 + 83,000 = -146,000 | ||
| + | |||
| + | ==HFE Details== | ||
'''Schedule & Duration''' | '''Schedule & Duration''' | ||
*November 10, 9:00 am begin upramp to powerplant capacity (~9,100 cfs) | *November 10, 9:00 am begin upramp to powerplant capacity (~9,100 cfs) | ||
| Line 36: | Line 57: | ||
'''Releases and Lake Elevation''' | '''Releases and Lake Elevation''' | ||
| − | *Releases will range from | + | *Releases will range from 6,500 to 9,000 cfs prior to and after the HFE |
*Estimated acre feet of water bypassed during HFE: '''~129 kaf''' | *Estimated acre feet of water bypassed during HFE: '''~129 kaf''' | ||
*November volume = '''670 kaf''' | *November volume = '''670 kaf''' | ||
'''Costs''' | '''Costs''' | ||
| − | *Estimated costs to hydropower: '''$1.749 | + | *Estimated costs to hydropower: '''$1.749 million ''' |
*Actual costs to hydropower: [[Media:Financial Analysis of Experimental Releases Conducted at Glen Canyon Dam WY15.pdf| '''$2.1 million''']] | *Actual costs to hydropower: [[Media:Financial Analysis of Experimental Releases Conducted at Glen Canyon Dam WY15.pdf| '''$2.1 million''']] | ||
*Direct expenses for removal of concession assets: '''$9,961''' | *Direct expenses for removal of concession assets: '''$9,961''' | ||
| Line 64: | Line 85: | ||
*'''Pueblo of Zuni:''' concern that multiple HFE's under the HFE protocol could result in power cost increases for individual rate payers. | *'''Pueblo of Zuni:''' concern that multiple HFE's under the HFE protocol could result in power cost increases for individual rate payers. | ||
''Request to USBR made for detailed description on how the economic effects of multiple HFEs on power rate payers will be monitored.'' | ''Request to USBR made for detailed description on how the economic effects of multiple HFEs on power rate payers will be monitored.'' | ||
| − | |||
| − | |||
| − | |||
| − | |||
| − | |||
== ADDITIONAL == | == ADDITIONAL == | ||
Latest revision as of 15:40, 2 July 2020
| High Flow Experiment- 2014 | |
 |
Contents
[hide]2014 High Flow Experiment Snapshot
- The 2014 HFE represents the 3rd controlled high flow release conducted under the HFE Protocol.
A preliminary analysis of these images indicates that sandbar size increased at 57% of sites, remained unchanged and 31% of sites, and decreased at 12% of sites, a response similar to those observed during each of the 2012-2013 HFEs.
- Before and after images from the November 2014 HFE from each of the 45 sandbar sites monitored with remotely deployed digital cameras are available here.
Sediment Conditions
Fall Accounting Period- Paria input (Jul 1 - Nov 9): 1,213,000
- Accumulated in Upper Marble Canyon (Jul 1 - Nov 9, lower bound) = 815,000
- Accumulated in Lower Marble Canyon (Jul 1 - Nov 9, lower bound) = 239,000
- Available for HFE: 815,000 + 239,000 = 1,054,000
- Paria input (Nov 10 - 15): 0
- Evacuated from Upper Marble Canyon (Nov 10 - 15, lower bound) = -631,000
- Evacuated from Lower Marble Canyon (Nov 10 - 15, lower bound) = -37,000
- Left over in Marble Canyon after HFE (Nov 10 - 15): 1,054,000 - 631,000 - 37,000 = 386,000
- Paria input (Dec 1 to Apr 1): 13,000
- Evacuated from Upper Marble Canyon (Dec 1 to Apr 1, lower bound) = -229,000
- Accumulated in Lower Marble Canyon (Dec 1 to Apr 1, lower bound) = 83,000
- Available for spring HFE: -229,000 + 83,000 = -146,000
HFE Details
Schedule & Duration
- November 10, 9:00 am begin upramp to powerplant capacity (~9,100 cfs)
- November 15, 2:00 pm end of HFE
- Total duration: 5 days & 5 hours (96 hours at peak release)
Ramp Rates
- Ramp up: 4,000 cfs/hr from 5,000 - 19,100 cfs, then 3,750 cfs/hr to peak (37,500 cfs)
- Ramp down: 1,875 cfs/hr from 37,500 - 19,100 cfs, then 1,500 cfs/hr to 8,000 cfs
HFE Release Details
- Maximum total release: ~37,500 cfs
- Powerplant capacity: ~19,100 cfs
- River outlet tubes: 15,000 cfs
- Hydropower generation units available: 7
- River outlet tubes: 4
Releases and Lake Elevation
- Releases will range from 6,500 to 9,000 cfs prior to and after the HFE
- Estimated acre feet of water bypassed during HFE: ~129 kaf
- November volume = 670 kaf
Costs
- Estimated costs to hydropower: $1.749 million
- Actual costs to hydropower: $2.1 million
- Direct expenses for removal of concession assets: $9,961
SUPPORTING DOCUMENTS
- Financial Analysis of Experimental Releases Conducted at Glen Canyon Dam during Water Year 2015 by D.J. Graziano, L.A. Poch, and T.D. Veselka.
- Updates on 2014 HFE, 2015 Paria sediment inputs, and sediment mass balance
- Memo from Jennifer Gimbel, Chair, Glen Canyon Leadership Team dated October 24, 2014, to Brent Rhees, Acting Regional Director, Subject: Approval of Recommendation for Experimental High-Flow Release from Glen Canyon Dam, November 2014*Fall 2014 HFE Planning and PPT
- DOI Memo: Approval of Recommendation for Experimental High-Flow release from Glen Canyon Dam, November 2014
- Planning for a Fall 2014 High Flow Experiment
- Fall 2014 HFE Planning
COMPLIANCE
- A 30-day letter was sent notifying MOA signatories of a possible HFE in October 9, 2014.
- DOI consultation meeting with the Basin States_ October 07, 2014.
- Government to Government tribal consultation: Pueblo of Zuni_
- Government to Government tribal consultation: Navajo Nation_
- Report made available and presented at AMWG_ August 27-28, 2014.
- USBR conducted a webinar with TWG, October 1th, 2014.
CONCERNS
- Pueblo of Zuni: concern that multiple HFE's under the HFE protocol could result in power cost increases for individual rate payers.
Request to USBR made for detailed description on how the economic effects of multiple HFEs on power rate payers will be monitored.
ADDITIONAL
- GCMRC has installed digital cameras that capture 5 Images every day at 43 sandbar monitoring sites throughout Marble and Grand Canyon between Lees Ferry and Diamond Creek.
- Modified original proposal to avoid additional WAPA hydropower loss (off-peak hour sales) -- Saves $30,000
- Glen Canyon Dam will start pumping an Olympic-sized swimming pool worth of water into the Colorado River every other minute--INCORRECT--LINK
- “By sending enough water downstream to fill an Olympic-sized swimming pool every few seconds...
- The 96-hour-release will pick up enough sand from river channels to fill a building as big as a football field and as tall as the Washington Monument, all the way to the brim.”
- Lake Powell is expected to drop 2.5 feet during the course of the week. --LINK
- SVaderkooi Fact Check on swimming pool comparison: Wikipedia Swimming pool size. Assuming a depth of 2 m, a 50 m x 25 m pool equals about 88,000 cubic feet. At peak Reclamation said the release from the dam was around 34,000 cfs so an olympic-sized pool would fill in about 2.6 s. Note that the USGS gage at Lees Ferry measured peak flow at about 37,000 cfs, so a little quicker (about 2.4 s) if you use that number.
Contributor: Category: Sediment, Recreation, Water delivery


