Difference between revisions of "GCDAMP- HFE 2012"
From Glen Canyon Dam AMP
(add Feds’ Grand Canyon flood a success) |
Cellsworth (Talk | contribs) |
||
| (25 intermediate revisions by 2 users not shown) | |||
| Line 11: | Line 11: | ||
|birth_place = | |birth_place = | ||
}} | }} | ||
| − | *'''HFE | + | |
| − | *'''[http://www. | + | == 2012 High Flow Experiment Snapshot == |
| + | *The 2012 HFE represents the '''1st''' controlled high flow release conducted under the [http://gcdamp.com/index.php?title=The_HFE_Page HFE Protocol]. | ||
| + | *A preliminary analysis of these images indicates that sandbar size increased at 52% of sites, remained unchanged and 39% of sites, and decreased at 9% of sites. | ||
| + | *Before and after images from the November 2012 HFE from each of the 33 sandbar sites monitored with remotely deployed digital cameras are available [https://grandcanyon.usgs.gov/gisapps/sandbartour2012/index.html? '''here''']. | ||
| + | |||
| + | ==Sediment Conditions== | ||
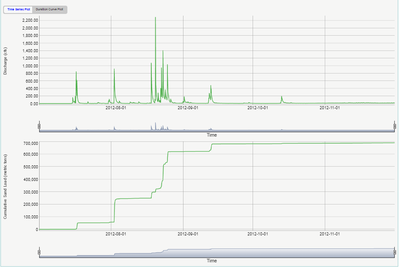
| + | '''Fall Accounting Period''' [[File:2012 FallHFE Paria.png|thumb|right|400px|[http://www.gcmrc.gov/discharge_qw_sediment/station/GCDAMP/09382000#/ '''Paria River gage at Lees Ferry'''] ]] | ||
| + | *Paria input (July 1 - Nov 18) = 690,000 | ||
| + | *Accumulated in Upper Marble Canyon (Jul 1 - Nov 18, lower bound) = 542,000 | ||
| + | *Evacuated from Lower Marble Canyon (Jul 1 - Nov 18, lower bound) = -33,000 | ||
| + | *Available for fall HFE: 542,000 - 33,000 = 509,000 | ||
| + | |||
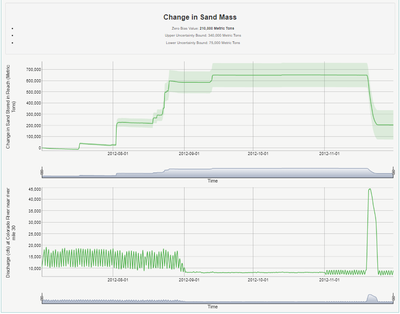
| + | '''HFE Transport''' [[File:2012 FallHFE UpperMarbleCanyon_(1).png|thumb|right|400px|[http://www.gcmrc.gov/discharge_qw_sediment/reach/GCDAMP/09380000/09383050 '''Upper Marble Canyon'''] ]] | ||
| + | *Paria input (Nov 19 - 24): 1,000 | ||
| + | *Evacuated from Upper Marble Canyon (Nov 19 - 24, lower bound) = -466,000 | ||
| + | *Accumulated in Lower Marble Canyon (Nov 19 - 24, lower bound) = 5,000 | ||
| + | *Left over in Marble Canyon after HFE (Nov 19 - 24): 509,000 +1,000 - 466,000 + 5,000 = 49,000 | ||
| + | |||
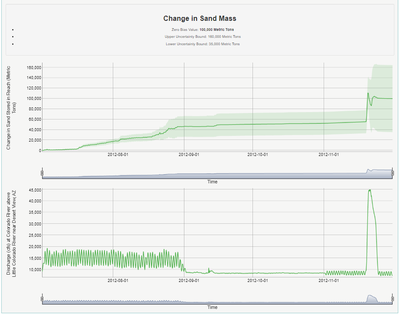
| + | '''Spring Accounting Period''' [[File:2012 FallHFE LowerMarbleCanyon_(1).png|thumb|right|400px|[http://www.gcmrc.gov/discharge_qw_sediment/reach/GCDAMP/09383050/09383100 '''Lower Marble Canyon'''] ]] | ||
| + | *Paria input (Dec 1 to Apr 1) = 50,000 | ||
| + | *Evacuated from Upper Marble Canyon (Dec 1 to Apr 1, lower bound) = -29,000 | ||
| + | *Evacuated from Lower Marble Canyon (Dec 1 to Apr 1, lower bound) = -6,000 | ||
| + | *Available for spring HFE: -29,000 - 6,000 = -35,000 | ||
| + | |||
| + | ==HFE Details== | ||
| + | '''Schedule & Duration''' | ||
| + | *Nov. 18 begin upramp to powerplant capacity | ||
| + | *Nov. 19- 12:00 p.m. open bypass tubes | ||
| + | *Nov. 23 - 7:00 p.m. end of HFE | ||
| + | *Total duration: 5 days & 5 hours ('''96 hours''' at peak release) | ||
| + | |||
| + | '''Ramp Rates''' | ||
| + | *Ramp up: 4,000 cfs/hr from 9,000 - 27,300 cfs, then 3,750 cfs/hr to peak | ||
| + | *Ramp down: 1,000 cfs/hr from 31,300 - 27,300 cfs, then 1,500 cfs/hr from 27,300 cfs | ||
| + | |||
| + | '''HFE Release Details''' | ||
| + | *Maximum total release: '''42,300 cfs''' | ||
| + | *Powerplant capacity: 27,300 cfs | ||
| + | *River outlet tubes: 15,000 cfs | ||
| + | *Hydropower generation units available: 8 | ||
| + | *River outlet tubes: 4 | ||
| + | |||
| + | '''Releases and Lake Elevation''' | ||
| + | *Releases will range from 7,000 - 9,000 cfs prior to and after the HFE | ||
| + | *Lake elevation is projected to decrease by approximately 2.5 feet during the 5-day period | ||
| + | *Estimated acre feet of water bypassed during HFE: 79,000 af | ||
| + | *November volume = xx kaf | ||
| + | |||
| + | '''Costs''' | ||
| + | *Actual costs to hydropower: [[Media:Financial Analysis of Experimental Flows Vol5 WY13 Final.pdf| '''$1.918 million*]] (includes costs of 2012 Fall Steady Flow Experiment)''' | ||
== SUPPORTING DOCUMENTS == | == SUPPORTING DOCUMENTS == | ||
| − | * | + | *[[Media:Financial Analysis of Experimental Flows Vol5 WY13 Final.pdf| Financial Analysis of Experimental Releases Conducted at Glen Canyon Dam during Water Year 2013 by D.J. Graziano, L.A. Poch, T.D. Veselka, C.S. Palmer,* S. Loftin,* and B. Osiek*]] |
| + | *[http://www.usbr.gov/uc/rm/gcdHFE/2012/ USBR 2012 HFE LINK] | ||
| + | *[http://www.youtube.com/watch?v=kNmtWUBYf0s&feature=youtu.be AZ Game & Fish_Glen Canyon Dam High Flow Releases-2012 VIDEO CLIP] | ||
| + | *[http://www.usbr.gov/uc/rm/gcdHFE/2012/video/index.html 2012 HFE video] | ||
| + | *[http://gcdamp.com/images/e/e5/2012_HFE_-PIC.jpg 2012 HFE pictures] | ||
| + | *[https://www.usbr.gov/uc/rm/amp/twg/mtgs/13jan24/16_Grams.pdf Sandbar Monitoring for November 2012 Controlled Flood] | ||
== COMPLIANCE == | == COMPLIANCE == | ||
| − | + | [http://gcdamp.com/index.php?title=The_HFE_Page HFE Protocol] | |
| − | + | ||
== SAND TRANSPORT caused by 2012 HFE == | == SAND TRANSPORT caused by 2012 HFE == | ||
| Line 27: | Line 80: | ||
*@ RM225 = 970,000 metric tons | *@ RM225 = 970,000 metric tons | ||
*At Diamond Creek (RM225), 1,810,000 metric tons were transported by the Colorado River between July 1, 2012, and July 1, 2013. Thus, '''54% of the total delivery of sand to Lake Mead reservoir during this 1-year period occurred during approximately 5 days of the November 2012 HFE.''' For comparison, 45% of the total delivery of sand to Lake Mead reservoir during calendar year 2008 occurred during the 2008 HFE; the 2004 HFE delivered 40% of the total sand delivered to Lake Mead in calendar year 2004. | *At Diamond Creek (RM225), 1,810,000 metric tons were transported by the Colorado River between July 1, 2012, and July 1, 2013. Thus, '''54% of the total delivery of sand to Lake Mead reservoir during this 1-year period occurred during approximately 5 days of the November 2012 HFE.''' For comparison, 45% of the total delivery of sand to Lake Mead reservoir during calendar year 2008 occurred during the 2008 HFE; the 2004 HFE delivered 40% of the total sand delivered to Lake Mead in calendar year 2004. | ||
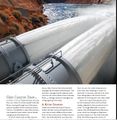
| + | *500,000 tons of sediment is equivelant to filling a football field 230 feet deep (KSalazar) | ||
| + | [[File:Football field- PIC.jpg|thumb]] | ||
| − | == | + | == RESULTS OF 2012 HFE == |
| − | *''' | + | *[http://www.gcmrc.gov/gis/sandbartour2012/index.html '''2012 Sandbar tour''': deposition following the 2012 high flow on the Colorado River in Grand Canyon] |
| − | *[ | + | *'''Substantial Gain''' to '''18 Sandbars'''--- 55% of sites. |
| + | *'''No Substantial Change''' in '''12 sandbars''' --- 36% of sites. | ||
| + | *'''Substantial Loss''' of '''3 sandbars''' --- 9% of sites. | ||
| + | *The 2012 HFE with more gradual downramp rate (Table 1) resulted in flatter sandbars than were observed following the 2008 HFE at two of the three sites were topographic surveys were completed after both high flows. At river mile (RM) 9 there was a 9 percent increase in the proportion of the sandbar with slope less than 8 degrees and at RM 30 there was a 17 percent increase in the proportion with slope less than 8 degrees (Table 5). At RM 47 the proportion of the sandbar with slope less than 8 degrees decreased by 9 percent. [https://www.usbr.gov/uc/progact/amp/amwg/2019-03-06-amwg-meeting/20190301-HFE_Extended_Abstracts-Combined_FINAL.pdf] | ||
| + | *'''RESULTS: 6 Months Later (MAY 2013)''' | ||
| + | *Most sandbars constructed by the 2012 HFE eroded by May 2013. | ||
| + | *'''8''' sites were still somewhat larger, '''14''' sites remained the same, '''7''' were smaller. | ||
== Effects on Resources == | == Effects on Resources == | ||
| Line 48: | Line 109: | ||
Image:2012 HFE -PIC.jpg | Image:2012 HFE -PIC.jpg | ||
Image:2012 HFE Snapshot.jpg | Image:2012 HFE Snapshot.jpg | ||
| + | Image:2012 AZGF- River Changed Article- PIC.jpg | ||
Image:AZVideo - 2012 HFE- Jack Schmit.jpg | Image:AZVideo - 2012 HFE- Jack Schmit.jpg | ||
| Line 53: | Line 115: | ||
</center> | </center> | ||
*[http://www.azcentral.com/video/1982045199001 AZ News Central Video- HFE, Sediment, Jack Schmidt, monitoring LINK] | *[http://www.azcentral.com/video/1982045199001 AZ News Central Video- HFE, Sediment, Jack Schmidt, monitoring LINK] | ||
| − | *[http://www.azcentral.com/news/articles/20130124feds-grand-canyon-flood-success-beaches-habitat-restored.html?nclick_check=1 Feds’ Grand Canyon flood a success] | + | *[http://www.azcentral.com/news/articles/20130124feds-grand-canyon-flood-success-beaches-habitat-restored.html?nclick_check=1 Feds’ AZ Central News_ Grand Canyon flood a success] |
| + | *[http://gcdamp.com/images/1/18/SO12_Stewart.pdf Arizona Game and Fish Wildlife Views article titled "A Changing Grand Canyon: Can high flows help?" (Published October 2012) -Bill Stewart] | ||
---- | ---- | ||
Contributor: | Contributor: | ||
Category: Sediment, Recreation, Water delivery | Category: Sediment, Recreation, Water delivery | ||
Latest revision as of 11:50, 8 July 2020
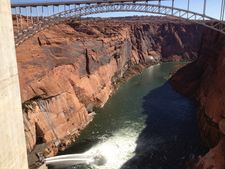
| High Flow Experiment- 2012 | |
 |
Contents
[hide]2012 High Flow Experiment Snapshot
- The 2012 HFE represents the 1st controlled high flow release conducted under the HFE Protocol.
- A preliminary analysis of these images indicates that sandbar size increased at 52% of sites, remained unchanged and 39% of sites, and decreased at 9% of sites.
- Before and after images from the November 2012 HFE from each of the 33 sandbar sites monitored with remotely deployed digital cameras are available here.
Sediment Conditions
Fall Accounting Period- Paria input (July 1 - Nov 18) = 690,000
- Accumulated in Upper Marble Canyon (Jul 1 - Nov 18, lower bound) = 542,000
- Evacuated from Lower Marble Canyon (Jul 1 - Nov 18, lower bound) = -33,000
- Available for fall HFE: 542,000 - 33,000 = 509,000
- Paria input (Nov 19 - 24): 1,000
- Evacuated from Upper Marble Canyon (Nov 19 - 24, lower bound) = -466,000
- Accumulated in Lower Marble Canyon (Nov 19 - 24, lower bound) = 5,000
- Left over in Marble Canyon after HFE (Nov 19 - 24): 509,000 +1,000 - 466,000 + 5,000 = 49,000
- Paria input (Dec 1 to Apr 1) = 50,000
- Evacuated from Upper Marble Canyon (Dec 1 to Apr 1, lower bound) = -29,000
- Evacuated from Lower Marble Canyon (Dec 1 to Apr 1, lower bound) = -6,000
- Available for spring HFE: -29,000 - 6,000 = -35,000
HFE Details
Schedule & Duration
- Nov. 18 begin upramp to powerplant capacity
- Nov. 19- 12:00 p.m. open bypass tubes
- Nov. 23 - 7:00 p.m. end of HFE
- Total duration: 5 days & 5 hours (96 hours at peak release)
Ramp Rates
- Ramp up: 4,000 cfs/hr from 9,000 - 27,300 cfs, then 3,750 cfs/hr to peak
- Ramp down: 1,000 cfs/hr from 31,300 - 27,300 cfs, then 1,500 cfs/hr from 27,300 cfs
HFE Release Details
- Maximum total release: 42,300 cfs
- Powerplant capacity: 27,300 cfs
- River outlet tubes: 15,000 cfs
- Hydropower generation units available: 8
- River outlet tubes: 4
Releases and Lake Elevation
- Releases will range from 7,000 - 9,000 cfs prior to and after the HFE
- Lake elevation is projected to decrease by approximately 2.5 feet during the 5-day period
- Estimated acre feet of water bypassed during HFE: 79,000 af
- November volume = xx kaf
Costs
- Actual costs to hydropower: $1.918 million* (includes costs of 2012 Fall Steady Flow Experiment)
SUPPORTING DOCUMENTS
- Financial Analysis of Experimental Releases Conducted at Glen Canyon Dam during Water Year 2013 by D.J. Graziano, L.A. Poch, T.D. Veselka, C.S. Palmer,* S. Loftin,* and B. Osiek*
- USBR 2012 HFE LINK
- AZ Game & Fish_Glen Canyon Dam High Flow Releases-2012 VIDEO CLIP
- 2012 HFE video
- 2012 HFE pictures
- Sandbar Monitoring for November 2012 Controlled Flood
COMPLIANCE
SAND TRANSPORT caused by 2012 HFE
- @ RM30 = 390,000 metric tons
- @ RM60 = 380,000 metric tons
- @ RM87 = 540,000 metric tons
- @ RM225 = 970,000 metric tons
- At Diamond Creek (RM225), 1,810,000 metric tons were transported by the Colorado River between July 1, 2012, and July 1, 2013. Thus, 54% of the total delivery of sand to Lake Mead reservoir during this 1-year period occurred during approximately 5 days of the November 2012 HFE. For comparison, 45% of the total delivery of sand to Lake Mead reservoir during calendar year 2008 occurred during the 2008 HFE; the 2004 HFE delivered 40% of the total sand delivered to Lake Mead in calendar year 2004.
- 500,000 tons of sediment is equivelant to filling a football field 230 feet deep (KSalazar)
RESULTS OF 2012 HFE
- 2012 Sandbar tour: deposition following the 2012 high flow on the Colorado River in Grand Canyon
- Substantial Gain to 18 Sandbars--- 55% of sites.
- No Substantial Change in 12 sandbars --- 36% of sites.
- Substantial Loss of 3 sandbars --- 9% of sites.
- The 2012 HFE with more gradual downramp rate (Table 1) resulted in flatter sandbars than were observed following the 2008 HFE at two of the three sites were topographic surveys were completed after both high flows. At river mile (RM) 9 there was a 9 percent increase in the proportion of the sandbar with slope less than 8 degrees and at RM 30 there was a 17 percent increase in the proportion with slope less than 8 degrees (Table 5). At RM 47 the proportion of the sandbar with slope less than 8 degrees decreased by 9 percent. [1]
- RESULTS: 6 Months Later (MAY 2013)
- Most sandbars constructed by the 2012 HFE eroded by May 2013.
- 8 sites were still somewhat larger, 14 sites remained the same, 7 were smaller.
Effects on Resources
- Cultural: No adverse effects to historic properties of the 2012 HFE were identified. (USBR Memo 2013)
- HBC & Native Fish: No measuable positive effect on HBC or other native fish. (Provisional- unpublished data)
- RBT Monitoring: RBT in Glen Canyon moved very little during the period around HFE.
- Foodbase: Initial results do not indicate a strong effect on food base-- but is expected to take longer to recover over the winter period (GCMRC unpublished data)
- Kanab Ambersnail: FWS found in its 2011 BO that this loss of snails/ habitat would not jeopardize the continued existence of the snail
- Whirling Disease: HFE's pose little risk of spreading whirling disease (GCMRC Assessment)
- AZ News Central Video- HFE, Sediment, Jack Schmidt, monitoring LINK
- Feds’ AZ Central News_ Grand Canyon flood a success
- Arizona Game and Fish Wildlife Views article titled "A Changing Grand Canyon: Can high flows help?" (Published October 2012) -Bill Stewart
Contributor: Category: Sediment, Recreation, Water delivery
