Difference between revisions of "GCDAMP Sediment"

From Glen Canyon Dam AMP
Jump to: navigation, search
Line 234: Line 234:
  
 
'''2009'''
 
'''2009'''
 +
*[https://www.usbr.gov/uc/rm/amp/twg/mtgs/09sep29/Attach_06.pdf Grand Canyon Monitoring and Research Center Updates]
 
*[https://www.usbr.gov/uc/rm/amp/amwg/mtgs/09apr29/Attach_03a.pdf AIF: Grand Canyon Monitoring and Research Center (GCMRC) Update]
 
*[https://www.usbr.gov/uc/rm/amp/amwg/mtgs/09apr29/Attach_03a.pdf AIF: Grand Canyon Monitoring and Research Center (GCMRC) Update]
 
*[https://www.usbr.gov/uc/rm/amp/amwg/mtgs/09apr29/Attach_03d.pdf Water Quality and Sediment, 2008 High Flow Experiment, and Integrated Flow, Temperature, and Sediment Modeling PPT]
 
*[https://www.usbr.gov/uc/rm/amp/amwg/mtgs/09apr29/Attach_03d.pdf Water Quality and Sediment, 2008 High Flow Experiment, and Integrated Flow, Temperature, and Sediment Modeling PPT]

Revision as of 15:55, 9 July 2018


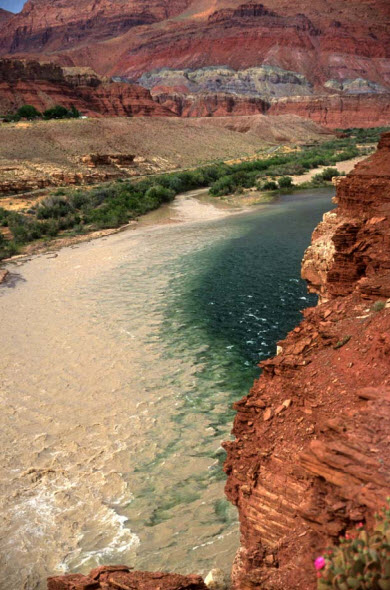
The Paria River flowing into the mainstem Colorado River‎


Sediment and Geomorphology

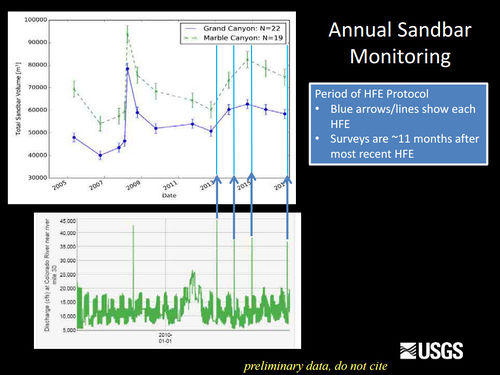
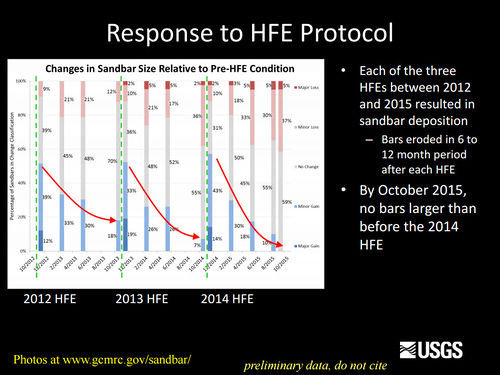
Erosion of sandbars (beaches) along the Colorado River in Grand Canyon was first reported in the early 1970s, approximately 10 years after completion of Glen Canyon Dam. Since then, scientific studies have been conducted to monitor changes in sandbars and changes in the amount of sand stored on the bed of the river. One of the outcomes of these studies has been the implementation of flow experiments intended to rebuild eroded sandbars, especially by the release of controlled floods, also called High Flow Experiments, or HFEs, from Glen Canyon Dam. The sediment and geomorphology projects at Grand Canyon Monitoring and Research Center include the collection and processing of data to provide information needed to conduct controlled floods and to evaluate the outcome of each controlled flood and the long-term effects of controlled floods and normal dam operations on sediment-related resources. [1]

Beginning in 1998, recreational campsite area has also been measured on a subset of the sandbar monitoring sites. Campsite areas are defined as areas that are flat (less than 8 degree slope), smooth (not rocky), and clear of dense vegetation. Monitoring data show that vegetation expansion and sandbar erosion/deposition contribute to reductions in campsite area.

LTEMP Resource Goal for Sediment

Increase and retain fine sediment volume, area, and distribution in the Glen, Marble, and Grand Canyon reaches above the elevation of the average base flow for ecological, cultural, and recreational purposes.

Desired Future Condition for Sediment-Related Resources

High elevation open riparian sediment deposits along the Colorado River in sufficient volume, area, and distribution so as to provide habitat to sustain native biota and desired ecosystem processes
• Nearshore habitats for native fish
• Marsh and riparian habitat for fish (food chain maintenance)
• Cultural resource preservation
• Maintenance of camping beaches

---
---
---

Updates

SandbarMonitoring2016.jpg
[2]
2012 2014 HFE response.jpg
[3]
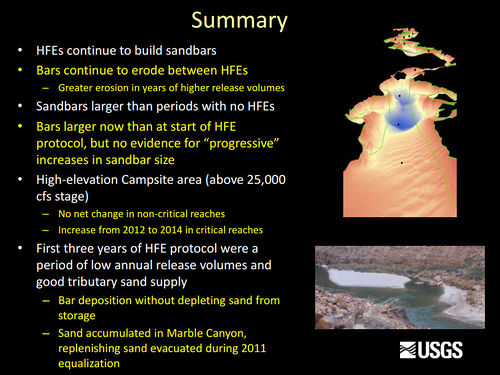
2016 SedimentSummary.jpg
[4]

Sediment transport and river discharge

When the discharge of the Colorado River was lower than about 9,000 ft3/s, sand accumulated in the reach in Marble and upper Grand Canyons. At discharges higher than about 9,000 ft3/s, however, sand-transport rates at the Grand Canyon gaging station generally equaled those at the Lees Ferry gaging station, and at discharges higher than about 16,000 ft3/s, sand-transport rates at the Grand Canyon gaging station generally either equaled or exceeded those at the Lees Ferry gaging station. Thus, at discharges greater than about 9,000 ft3/s, sand was either conveyed through or eroded from the reach in Marble and upper Grand Canyons.

As discharges less than 9,000 ft3/s became less common, the discharge of the river became progressively more conducive to the conveyance of sand through or the erosion of sand from Marble and upper Grand Canyons.

Links and Information

Projects

Sediment Gages

Sand Mass Balance Reaches in Grand Canyon

Presentations and Papers

2018

2017

2016

2015

2014

2013

2012

2011

2010

2009

2003

1999

1988

Other Stuff

Measuring turbidity

Question: What is the difference between the turbidity units NTU, FNU, FTU, and FAU? What is a JTU?

Summary: Turbidity units NTU, FNU, FTU, FAU, and JTU

Answer:

  • NTU stands for Nephelometric Turbidity Unit and signifies that the instrument is measuring scattered light from the sample at a 90-degree angle from the incident light.
  • FNU stands for Formazin Nephelometric Units and also signifies that the instrument is measuring scattered light from the sample at a 90-degree angle from the incident light. FNU is most often used when referencing the ISO 7027 (European) turbidity method.
  • NTU is most often used when referencing the USEPA Method 180.1 or Standard Methods For the Examination of Water and Wastewater.
  • When formazin was initially adopted as the primary reference standard for turbidity, units of FTU or Formazin Turbidity Units were used. These units, however, do not specify how the instrument measures the sample.

FAU or Formazin Attenuation Units signify that the instrument is measuring the decrease in transmitted light through the sample at an angle of 180 degrees to the incident light. This type of measurement is often made in a spectrophotometer or colorimeter and is not considered a valid turbidity measurement by most regulatory agencies.

A JTU or Jackson Turbidity Unit is a historical unit used when measurements were made visually using a Jackson Candle Turbidimeter. Water was poured into a tube until a flame underneath the tube could no longer be distinguished.

The turbidity units NTU, FNU, FTU, AND FAU are all based on calibrations using the same formazin primary standards. Therefore when a formazin standard is measured, the value for each of these units will be the same, however the value on samples may differ significantly.


Flash Flood videos