Difference between revisions of "GCDAMP- HFE 2012"
From Glen Canyon Dam AMP
Cellsworth (Talk | contribs) |
Cellsworth (Talk | contribs) |
||
| Line 21: | Line 21: | ||
*Paria input (July 1 - Nov 18) = 690,000 | *Paria input (July 1 - Nov 18) = 690,000 | ||
*Accumulated in Upper Marble Canyon (Jul 1 - Nov 18, lower bound) = 542,000 | *Accumulated in Upper Marble Canyon (Jul 1 - Nov 18, lower bound) = 542,000 | ||
| − | *Evacuated from Lower Marble Canyon (Jul 1 - Nov 18, lower bound) = | + | *Evacuated from Lower Marble Canyon (Jul 1 - Nov 18, lower bound) = -33,000 |
*Available for fall HFE: 542,000 - 33,000 = 509,000 | *Available for fall HFE: 542,000 - 33,000 = 509,000 | ||
| Line 30: | Line 30: | ||
*Left over in Marble Canyon after HFE (Nov 19 - 24): 509,000 +1,000 - 466,000 + 5,000 = 49,000 | *Left over in Marble Canyon after HFE (Nov 19 - 24): 509,000 +1,000 - 466,000 + 5,000 = 49,000 | ||
| − | ''' | + | '''Spring Accounting Period''' [[File:2012 FallHFE LowerMarbleCanyon.png|thumb|right|400px|[http://www.gcmrc.gov/discharge_qw_sediment/reach/GCDAMP/09383050/09383100 '''Lower Marble Canyon'''] ]] |
*Paria input (Dec 1 to Apr 1) = 50,000 | *Paria input (Dec 1 to Apr 1) = 50,000 | ||
*Evacuated from Upper Marble Canyon (Dec 1 to Apr 1, lower bound) = -29,000 | *Evacuated from Upper Marble Canyon (Dec 1 to Apr 1, lower bound) = -29,000 | ||
Revision as of 12:11, 2 July 2020
| High Flow Experiment- 2012 | |
 |
Contents
2012 High Flow Experiment Snapshot
- The 2012 HFE represents the 1st controlled high flow release conducted under the HFE Protocol.
- A preliminary analysis of these images indicates that sandbar size increased at 52% of sites, remained unchanged and 39% of sites, and decreased at 9% of sites.
- Before and after images from the November 2012 HFE from each of the 33 sandbar sites monitored with remotely deployed digital cameras are available here.
Sediment Conditions
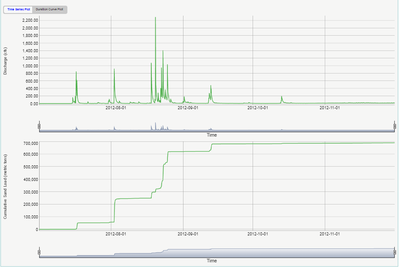
Fall Accounting Period- Paria input (July 1 - Nov 18) = 690,000
- Accumulated in Upper Marble Canyon (Jul 1 - Nov 18, lower bound) = 542,000
- Evacuated from Lower Marble Canyon (Jul 1 - Nov 18, lower bound) = -33,000
- Available for fall HFE: 542,000 - 33,000 = 509,000
- Paria input (Nov 19 - 24): 1,000
- Evacuated from Upper Marble Canyon (Nov 19 - 24, lower bound) = -466,000
- Accumulated in Lower Marble Canyon (Nov 19 - 24, lower bound) = 5,000
- Left over in Marble Canyon after HFE (Nov 19 - 24): 509,000 +1,000 - 466,000 + 5,000 = 49,000
- Paria input (Dec 1 to Apr 1) = 50,000
- Evacuated from Upper Marble Canyon (Dec 1 to Apr 1, lower bound) = -29,000
- Evacuated from Lower Marble Canyon (Dec 1 to Apr 1, lower bound) = -6,000
- Available for spring HFE: 50,000 - 29,000 - 6,000 = 15,000
HFE Details
Schedule & Duration
- Nov. 18 begin upramp to powerplant capacity
- Nov. 19- 12:00 p.m. open bypass tubes
- Nov. 23 - 7:00 p.m. end of HFE
- Total duration: 5 days & 5 hours (96 hours at peak release)
Ramp Rates
- Ramp up: 4,000 cfs/hr from 9,000 - 27,300 cfs, then 3,750 cfs/hr to peak
- Ramp down: 1,000 cfs/hr from 31,300 - 27,300 cfs, then 1,500 cfs/hr from 27,300 cfs
HFE Release Details
- Maximum total release: 42,300 cfs
- Powerplant capacity: 27,300 cfs
- River outlet tubes: 15,000 cfs
- Hydropower generation units available: 8
- River outlet tubes: 4
Releases and Lake Elevation
- Releases will range from 7,000 - 9,000 cfs prior to and after the HFE
- Lake elevation is projected to decrease by approximately 2.5 feet during the 5-day period
- Estimated acre feet of water bypassed during HFE: 79,000 af
- November volume = xx kaf
Costs
- Actual costs to hydropower: $1.918 million* (includes costs of 2012 Fall Steady Flow Experiment)
SUPPORTING DOCUMENTS
- Financial Analysis of Experimental Releases Conducted at Glen Canyon Dam during Water Year 2013 by D.J. Graziano, L.A. Poch, T.D. Veselka, C.S. Palmer,* S. Loftin,* and B. Osiek*
- USBR 2012 HFE LINK
- AZ Game & Fish_Glen Canyon Dam High Flow Releases-2012 VIDEO CLIP
- 2012 HFE video
- 2012 HFE pictures
- Sandbar Monitoring for November 2012 Controlled Flood
COMPLIANCE
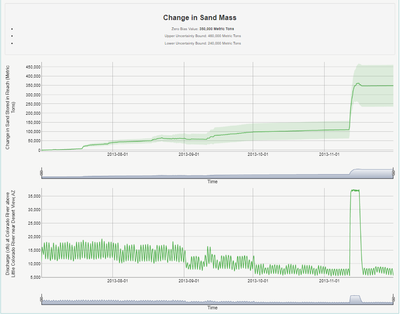
SAND TRANSPORT caused by 2012 HFE
- @ RM30 = 390,000 metric tons
- @ RM60 = 380,000 metric tons
- @ RM87 = 540,000 metric tons
- @ RM225 = 970,000 metric tons
- At Diamond Creek (RM225), 1,810,000 metric tons were transported by the Colorado River between July 1, 2012, and July 1, 2013. Thus, 54% of the total delivery of sand to Lake Mead reservoir during this 1-year period occurred during approximately 5 days of the November 2012 HFE. For comparison, 45% of the total delivery of sand to Lake Mead reservoir during calendar year 2008 occurred during the 2008 HFE; the 2004 HFE delivered 40% of the total sand delivered to Lake Mead in calendar year 2004.
- 500,000 tons of sediment is equivelant to filling a football field 230 feet deep (KSalazar)
RESULTS OF 2012 HFE
- 2012 Sandbar tour: deposition following the 2012 high flow on the Colorado River in Grand Canyon
- Substantial Gain to 18 Sandbars--- 55% of sites.
- No Substantial Change in 12 sandbars --- 36% of sites.
- Substantial Loss of 3 sandbars --- 9% of sites.
- RESULTS: 6 Months Later (MAY 2013)
- Most sandbars constructed by the 2012 HFE eroded by May 2013.
- 8 sites were still somewhat larger, 14 sites remained the same, 7 were smaller.
Effects on Resources
- Cultural: No adverse effects to historic properties of the 2012 HFE were identified. (USBR Memo 2013)
- HBC & Native Fish: No measuable positive effect on HBC or other native fish. (Provisional- unpublished data)
- RBT Monitoring: RBT in Glen Canyon moved very little during the period around HFE.
- Foodbase: Initial results do not indicate a strong effect on food base-- but is expected to take longer to recover over the winter period (GCMRC unpublished data)
- Kanab Ambersnail: FWS found in its 2011 BO that this loss of snails/ habitat would not jeopardize the continued existence of the snail
- Whirling Disease: HFE's pose little risk of spreading whirling disease (GCMRC Assessment)
- AZ News Central Video- HFE, Sediment, Jack Schmidt, monitoring LINK
- Feds’ AZ Central News_ Grand Canyon flood a success
- Arizona Game and Fish Wildlife Views article titled "A Changing Grand Canyon: Can high flows help?" (Published October 2012) -Bill Stewart
Contributor: Category: Sediment, Recreation, Water delivery


