Difference between revisions of "GCDAMP- HFE 2016"
From Glen Canyon Dam AMP
Cellsworth (Talk | contribs) |
Cellsworth (Talk | contribs) |
||
| (12 intermediate revisions by the same user not shown) | |||
| Line 14: | Line 14: | ||
== 2016 High Flow Experiment Snapshot == | == 2016 High Flow Experiment Snapshot == | ||
| − | *The 2016 HFE represents the '''4th''' controlled high flow release conducted under the [http://gcdamp.com/index.php?title=The_HFE_Page HFE Protocol]. | + | *The 2016 HFE represents the '''4th''' controlled high flow release conducted under the [http://gcdamp.com/index.php?title=The_HFE_Page HFE Protocol]. |
| + | *A preliminary analysis of these images indicates that sandbar size increased at 55% of sites, remained unchanged and 30% of sites, and decreased at 15% of sites, a response similar to those observed during each of the 2012-2014 HFEs. | ||
| + | *Before and after images from the November 2016 HFE from each of the 45 sandbar sites monitored with remotely deployed digital cameras are available [https://grandcanyon.usgs.gov/gisapps/sandbartour2016/index.html? '''here''']. | ||
| + | ==Sediment Conditions== | ||
| + | '''Fall Accounting Period''' [[File:2016 FallHFE Paria.png|thumb|right|400px|[http://www.gcmrc.gov/discharge_qw_sediment/station/GCDAMP/09382000#/ '''Paria River gage at Lees Ferry'''] ]] | ||
| + | *Paria input (Jul 1 - Nov 6): 844,748 | ||
| + | *Accumulated in Upper Marble Canyon (Jul 1 - Nov 6, lower bound) = 373,000 | ||
| + | *Accumulated in Lower Marble Canyon (Jul 1 - Nov 6, lower bound) = 72,000 | ||
| + | *Available for HFE: 373,000 + 72,000 = 445,000 | ||
| + | |||
| + | '''HFE Transport''' [[File:2016 FallHFE UpperMarbleCanyon.png|thumb|right|400px|[http://www.gcmrc.gov/discharge_qw_sediment/reach/GCDAMP/09380000/09383050 '''Upper Marble Canyon'''] ]] | ||
| + | *Paria input (Nov 7 - 12): 1,000 | ||
| + | *Evacuated from Upper Marble Canyon (Nov 7 - 12, lower bound) = -492,000 | ||
| + | *Evacuated from Lower Marble Canyon (Nov 7 - 12, lower bound) = -184,000 | ||
| + | *Left over in Marble Canyon after HFE (Nov 7 - 12): 445,000 + 1,000 - 492,000 - 184,000 = -230,000 | ||
| + | |||
| + | '''Spring Accounting Period''' [[File:2016 FallHFE LowerMarbleCanyon.png|thumb|right|400px|[http://www.gcmrc.gov/discharge_qw_sediment/reach/GCDAMP/09383050/09383100 '''Lower Marble Canyon'''] ]] | ||
| + | *Paria input (Dec 1 to Apr 1): 160,000 | ||
| + | *Evacuated from Upper Marble Canyon (Dec 1 to Apr 1, lower bound) = -241,000 | ||
| + | *Evacuated from Lower Marble Canyon (Dec 1 to Apr 1, lower bound) = -81,000 | ||
| + | *Available for spring HFE: -241,000 - 81,000 = -322,000 | ||
| + | |||
| + | ==HFE Details== | ||
'''Schedule & Duration''' | '''Schedule & Duration''' | ||
*Nov. 7 - 6 a.m. begin upramp to powerplant capacity ( ~21,000 cfs) | *Nov. 7 - 6 a.m. begin upramp to powerplant capacity ( ~21,000 cfs) | ||
| Line 42: | Line 64: | ||
'''Costs''' | '''Costs''' | ||
*Estimated costs to hydropower: '''$1.4 million''' | *Estimated costs to hydropower: '''$1.4 million''' | ||
| − | *Actual costs to hydropower: ''' | + | *Actual costs to hydropower: [https://publications.anl.gov/anlpubs/2019/06/151713.pdf '''1.15 million'''] |
*Direct expenses for removal of concession assets: '''TBD''' | *Direct expenses for removal of concession assets: '''TBD''' | ||
== SUPPORTING DOCUMENTS == | == SUPPORTING DOCUMENTS == | ||
| + | *[https://publications.anl.gov/anlpubs/2019/06/151713.pdf Financial Analysis of Experimental Releases Conducted at Glen Canyon Dam during Water Year 2017] | ||
*[http://www.usbr.gov/uc/rm/amp/twg/mtgs/16oct18/Attach_07.pdf Fall 2016 HFE Planning] | *[http://www.usbr.gov/uc/rm/amp/twg/mtgs/16oct18/Attach_07.pdf Fall 2016 HFE Planning] | ||
*[[Media:HFE TechTeam Rpt 16oct19.pdf|Technical Team Memo: Final Recommendation to Implement a Fall 2016 High Flow Experiment at Glen Canyon Dam]] | *[[Media:HFE TechTeam Rpt 16oct19.pdf|Technical Team Memo: Final Recommendation to Implement a Fall 2016 High Flow Experiment at Glen Canyon Dam]] | ||
| Line 58: | Line 81: | ||
*Re-emergence of [http://gcdamp.com/index.php?title=Green_Sunfish_Page '''green sunfish'''] in the -12 Mile Slough. | *Re-emergence of [http://gcdamp.com/index.php?title=Green_Sunfish_Page '''green sunfish'''] in the -12 Mile Slough. | ||
*Increase in [http://gcdamp.com/index.php?title=Brown_Trout '''brown trout'''] spawning and the increased prevalence of adult brown trout in the Lees Ferry reach since the beginning of the HFE Protocol. | *Increase in [http://gcdamp.com/index.php?title=Brown_Trout '''brown trout'''] spawning and the increased prevalence of adult brown trout in the Lees Ferry reach since the beginning of the HFE Protocol. | ||
| − | |||
| − | |||
| − | |||
== ADDITIONAL == | == ADDITIONAL == | ||
Latest revision as of 15:38, 2 July 2020
| High Flow Experiment- 2016 | |
 |
Contents
2016 High Flow Experiment Snapshot
- The 2016 HFE represents the 4th controlled high flow release conducted under the HFE Protocol.
- A preliminary analysis of these images indicates that sandbar size increased at 55% of sites, remained unchanged and 30% of sites, and decreased at 15% of sites, a response similar to those observed during each of the 2012-2014 HFEs.
- Before and after images from the November 2016 HFE from each of the 45 sandbar sites monitored with remotely deployed digital cameras are available here.
Sediment Conditions
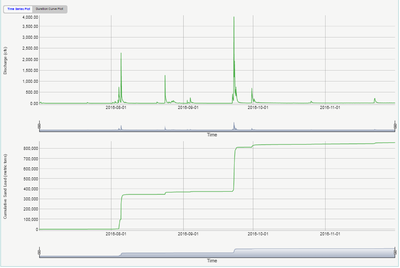
Fall Accounting Period- Paria input (Jul 1 - Nov 6): 844,748
- Accumulated in Upper Marble Canyon (Jul 1 - Nov 6, lower bound) = 373,000
- Accumulated in Lower Marble Canyon (Jul 1 - Nov 6, lower bound) = 72,000
- Available for HFE: 373,000 + 72,000 = 445,000
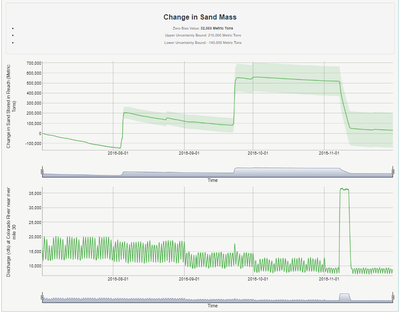
- Paria input (Nov 7 - 12): 1,000
- Evacuated from Upper Marble Canyon (Nov 7 - 12, lower bound) = -492,000
- Evacuated from Lower Marble Canyon (Nov 7 - 12, lower bound) = -184,000
- Left over in Marble Canyon after HFE (Nov 7 - 12): 445,000 + 1,000 - 492,000 - 184,000 = -230,000
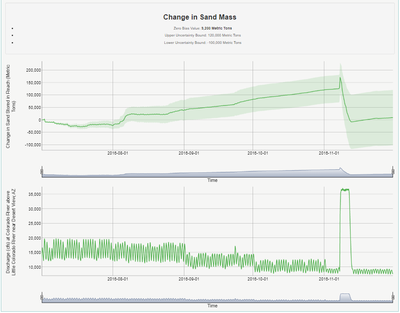
- Paria input (Dec 1 to Apr 1): 160,000
- Evacuated from Upper Marble Canyon (Dec 1 to Apr 1, lower bound) = -241,000
- Evacuated from Lower Marble Canyon (Dec 1 to Apr 1, lower bound) = -81,000
- Available for spring HFE: -241,000 - 81,000 = -322,000
HFE Details
Schedule & Duration
- Nov. 7 - 6 a.m. begin upramp to powerplant capacity ( ~21,000 cfs)
- Nov. 7 - 10:00 a.m. open bypass tubes, reach full bypass at 12:00 p.m.
- Nov. 11 - 12:00 p.m. end of bypass
- Nov. 12 - 3:00 a.m. end of HFE
- Total duration: 5 days & 5 hours (96 hours at peak release)
Ramp Rates
- Ramp up: 4,000 cfs/hr from 6,500 - 21,000 cfs, then 3,750 cfs/hr to peak (36,000 cfs)
- Ramp down: 1,875 cfs/hr from 36,000 - 21,000 cfs, then 1,500 cfs/hr to 9,000 cfs
HFE Release Details
- Maximum total release: 36,000 cfs
- Powerplant capacity: 21,000 cfs
- River outlet tubes: 15,000 cfs
- Hydropower generation units available: 6
- River outlet tubes: 4
Releases and Lake Elevation
- Releases will range from 6,500 - 9,000 cfs prior to and after the HFE
- Lake elevation is projected to decrease by approximately 2.5 feet during the 5-day period
- Estimated acre feet of water bypassed during HFE: 125 kaf
- November volume = 745 kaf
Costs
- Estimated costs to hydropower: $1.4 million
- Actual costs to hydropower: 1.15 million
- Direct expenses for removal of concession assets: TBD
SUPPORTING DOCUMENTS
- Financial Analysis of Experimental Releases Conducted at Glen Canyon Dam during Water Year 2017
- Fall 2016 HFE Planning
- Technical Team Memo: Final Recommendation to Implement a Fall 2016 High Flow Experiment at Glen Canyon Dam
- Leadership Team Memo: Approval of Recommendation for Experimental High-Flow release from Glen Canyon Dam, November 7-12, 2016
COMPLIANCE
CONCERNS
- Grand Canyon Private Boater's Association (GCPBA) letter requesting slower downramp rates following the Fall 2016 High flow experiment.
- Angler's concerns regarding a Fall 2016 High flow experiment on foodbase, trout condition, and disbursement of green sunfish. Also, noted that a comprehensive written three year review of the first three HFEs has not been provided yet.
- Re-emergence of green sunfish in the -12 Mile Slough.
- Increase in brown trout spawning and the increased prevalence of adult brown trout in the Lees Ferry reach since the beginning of the HFE Protocol.
ADDITIONAL


