Difference between revisions of "The Bugflow Experiment"
Cellsworth (Talk | contribs) |
Cellsworth (Talk | contribs) |
||
| Line 17: | Line 17: | ||
</table> | </table> | ||
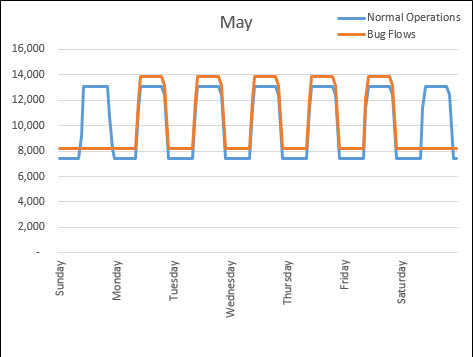
| − | [[File:BugflowHydrograph.jpg| | + | [[File:BugflowHydrograph.jpg|thumb|center|500px|Example of an experimental Macroinvertebrate Production Flow (MPF) hydrograph]] |
| − | Example of an experimental Macroinvertebrate Production Flow (MPF) hydrograph | + | |
<!-- | <!-- | ||
| Line 96: | Line 95: | ||
|style="color:#000;"| | |style="color:#000;"| | ||
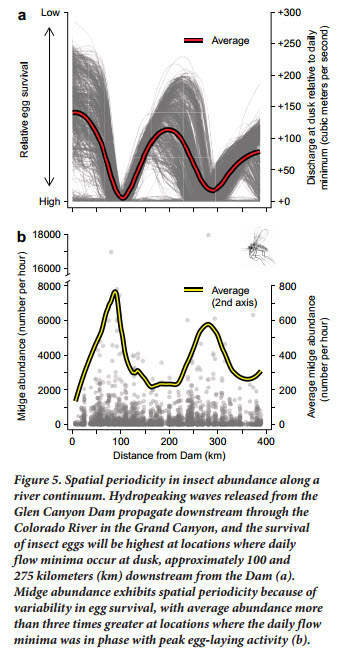
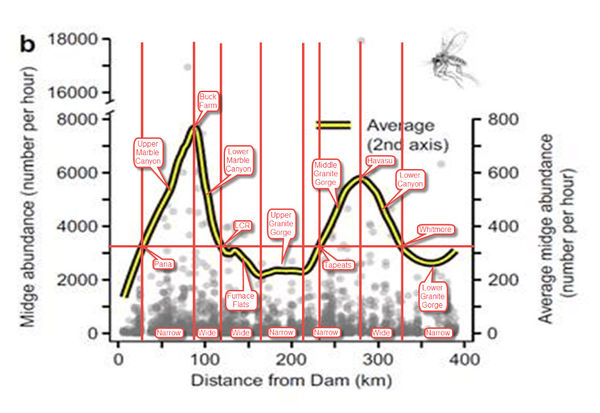
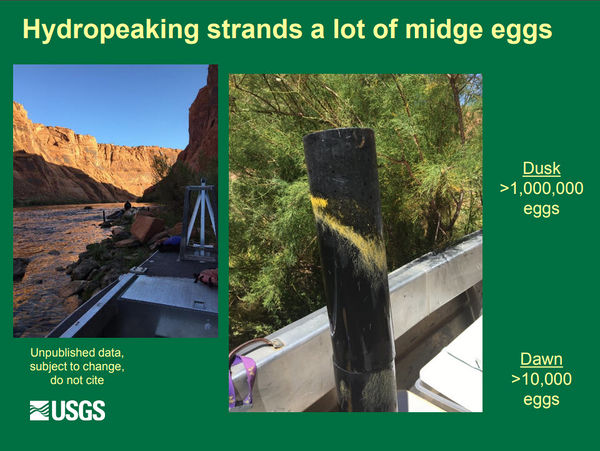
| − | Daily flow fluctuations dry and kill eggs laid in the evening along the shorelines. <br> | + | '''Hypothesis:''' Daily flow fluctuations dry and kill eggs laid in the evening along the shorelines resulting in population level declines in the abundance and diversity of aquatic macroinvertebrates (midges and EPT) below Glen Canyon Dam. <br> |
| − | [[File:MidgeAbundanceFlow.jpg|thumb| | + | '''Questions:''' Do bugflows increase the abundance and diversity of aquatic macroinvertebrates (midges and EPT) below Glen Canyon Dam? |
| + | *In areas where evening egg laying is out of sync (Glen Canyon, Upper and Lower Granite Gorge), can we detect increases egg laying and egg survival because of the low weekend flow? | ||
| + | *If observed, does increased egg laying and survival translate into increased larval and adult abundance and diversity? | ||
| + | *Additionally, steady flows are know to reduce aquatic macroinvertebrate drift. Do increases in production and diversity, if observed, compensate for decreases in drift? <br> | ||
| + | |||
| + | [[File:MidgeAbundanceFlow.jpg|thumb|left|400px| [http://gcdamp.com/images_gcdamp_com/7/70/Kennedy_2016_HydropowerEPT.pdf BioScience Paper] ]] | ||
| + | [[File:MidgeEggStrandingwRiverSegments.jpg|thumb|right|600px]] <br> | ||
[[File:MidgeEggStranding.jpg|thumb|center|600px|https://www.usbr.gov/uc/rm/amp/twg/mtgs/17jan26/AR19_Kennedy.pdf]] | [[File:MidgeEggStranding.jpg|thumb|center|600px|https://www.usbr.gov/uc/rm/amp/twg/mtgs/17jan26/AR19_Kennedy.pdf]] | ||
| Line 105: | Line 110: | ||
|style="color:#000;"| | |style="color:#000;"| | ||
| − | *[https://www.gcmrc.gov/research_areas/food_base/citizen_science_monitoring.aspx Citizen Science light trap monitoring | + | *[https://www.gcmrc.gov/research_areas/food_base/citizen_science_monitoring.aspx Citizen Science light trap monitoring throughout Glen and Grand Canyons] |
| − | *Drift: every 2 miles in Glen and Grand Canyons | + | *Drift: every 2(??) miles in Glen and Grand Canyons |
*Artificial egg-laying substrates?? | *Artificial egg-laying substrates?? | ||
| + | *Weekday vs weekend drift?? | ||
|- | |- | ||
| Line 115: | Line 121: | ||
*See an increase in the mean midge abundance (number caught/hr) in citizen scientist light trapping where midge abundance has historically been low (Glen Canyon, Upper Granite Gorge, Lower Granite Gorge) | *See an increase in the mean midge abundance (number caught/hr) in citizen scientist light trapping where midge abundance has historically been low (Glen Canyon, Upper Granite Gorge, Lower Granite Gorge) | ||
| − | *See an increase in EPT | + | *See an increase in midge egg survival and abundance of eggs laid on artificial substrates during the weekend vs eggs laid during the week in Glen Canyon |
| + | *See an increase in EPT abundance and diversity in the mainstem with larvae being caught in mainstem drift | ||
*See an increase in EPT egg laying on artificial substrates in the mainstem | *See an increase in EPT egg laying on artificial substrates in the mainstem | ||
| Line 156: | Line 163: | ||
|style="color:#000;"| | |style="color:#000;"| | ||
| + | *Foodbase: abundance, diversity, availability (drift) | ||
*Hydropower: value, capacity | *Hydropower: value, capacity | ||
*Trout and native fisheries: production, condition | *Trout and native fisheries: production, condition | ||
Revision as of 19:00, 15 March 2018
|
|
What is the “Macroinvertebrate Production Flow (MPF)" experiment? |
| EPT as Biologic Indicators of Stream Condition |
Algae and Aquatic Macrophytes |
Aquatic Macroinvertebrates |
|---|
|
|
