Difference between revisions of "The Bugflow Experiment"
Cellsworth (Talk | contribs) |
Cellsworth (Talk | contribs) |
||
| (83 intermediate revisions by the same user not shown) | |||
| Line 17: | Line 17: | ||
</table> | </table> | ||
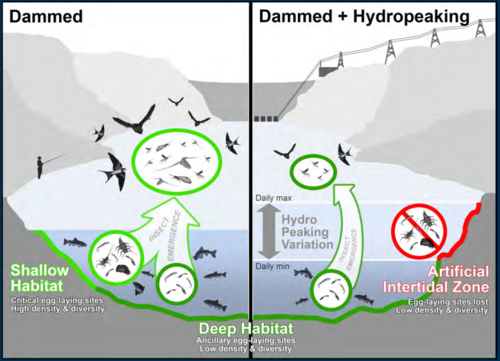
| − | [[File: | + | [[File:BugflowModel.PNG|thumb|center|500px|https://www.usbr.gov/uc/progact/amp/twg/2022-01-13-twg-meeting/20220113-AnnualReportingMeeting-ProjectF-AquaticEcologyFoodBaseMonitoring-508-UCRO.pdf]] |
| − | + | ||
<!-- | <!-- | ||
| Line 25: | Line 24: | ||
|style="width:60%; font-size:120%;"| | |style="width:60%; font-size:120%;"| | ||
| − | '''What is the | + | '''What is the “Macroinvertebrate Production Flow (MPF)" or "Bug Flow" experiment?''' <br> |
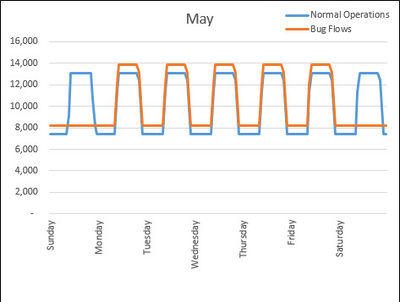
| − | This would be an experimental release at Glen Canyon Dam to see if short-duration steady | + | This would be an experimental release at Glen Canyon Dam to see if short-duration steady releases might increase the diversity and production of aquatic insects below Glen Canyon Dam. This experiment is included in the Preferred Alternative of the [http://gcdamp.com/index.php?title=Long-term_Experimental_and_Management_Plan_(LTEMP) LTEMP DEIS]. These “macroinvertebrate production flows” would occur from May to August and would maintain releases on the weekends to a level equal to the minimum release made during the week. This would allow aquatic insects two days a week throughout the river corridor to be able to lay their eggs at a stage where they would not be at risk of being dewatered or desiccated. The experiment would include monitoring to evaluate if the flows did increase the diversity and production of aquatic insects. The experiment was designed to test the hypothesis put forward in [[Media:Kennedy 2016 HydropowerEPT.pdf| '''Kennedy's 2016 BioScience Paper''']] while minimizing impacts to the hydropower resource at Glen Canyon Dam by having the steady flows on the weekend. This results in a transfer of water from the weekend to the weekdays increasing the daily minimums and maximums and the range of fluctuation during the week. Western believes that this experiment will result in only a small decrease in the energy value, but a modest increase in the capacity value of hydropower produced at Glen Canyon Dam. |
| + | |||
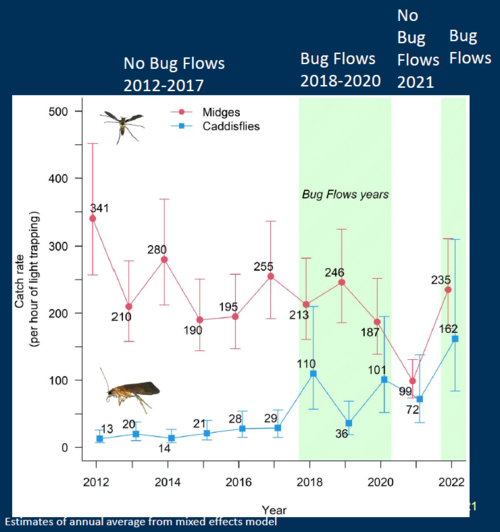
| + | Bugflows were implemented May-August in 2018, 2019, 2020, and 2022. | ||
|}<!-- | |}<!-- | ||
| Line 32: | Line 33: | ||
----------Strapline immediately below banner----------> | ----------Strapline immediately below banner----------> | ||
{| style="width:100%; height:50px" border=1px solid #ccc; background:#cedff2 | {| style="width:100%; height:50px" border=1px solid #ccc; background:#cedff2 | ||
| − | ! style="width=33%; background:#cedff2;" | [[ | + | ! style="width=33%; background:#cedff2;" | [[File:EPT.jpg|center|500px]] [https://www.wcc.nrcs.usda.gov/ftpref/wntsc/strmRest/wshedCondition/EPTIndex.pdf EPT as Biologic Indicators of Stream Condition] <br> |
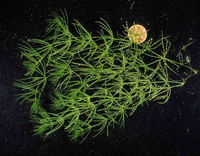
| − | ! style="width=33%; background:#cedff2;" | [[ | + | ! style="width=33%; background:#cedff2;" | [[File:Chara.jpg|center|200px]] [[Algae and Aquatic Macrophytes]] <br> |
| − | ! style="width=55%; background:#cedff2;" | [[ | + | ! style="width=55%; background:#cedff2;" | [[File:Macroinvertebrates.jpg|center|400px]] [[Aquatic Macroinvertebrates]] <br> |
|} | |} | ||
| Line 40: | Line 41: | ||
|class="MainPageBG" style="width:65%; border:1px solid #cef2e0; background:#f5faff; vertical-align:top; color:#000;"| | |class="MainPageBG" style="width:65%; border:1px solid #cef2e0; background:#f5faff; vertical-align:top; color:#000;"| | ||
{|width="100%" cellpadding="2" cellspacing="5" style="vertical-align:top; background:#f5faff;" | {|width="100%" cellpadding="2" cellspacing="5" style="vertical-align:top; background:#f5faff;" | ||
| − | ! <h2 style="margin:0; background:#cedff2; font-size:120%; font-weight:bold; border:1px solid #a3bfb1; text-align:left; color:#000; padding:0.2em 0.4em;">Updates</h2> | + | ! <h2 style="margin:0; background:#cedff2; font-size:120%; font-weight:bold; border:1px solid #a3bfb1; text-align:left; color:#000; padding:0.2em 0.4em;"> Updates </h2> |
|- | |- | ||
|style="color:#000;"| | |style="color:#000;"| | ||
| − | + | [[File:MidgeCaddisCatch_2012to2022.PNG|thumb|center|500px| [[Media:Kennedy JuneTWG for BAO.pdf| Experimental Bug Flows Enhance Natural Processes That Sustain The Colorado River Ecosystem]] ]] | |
| − | + | ||
| − | + | ||
| − | + | ||
| − | + | ||
| − | + | ||
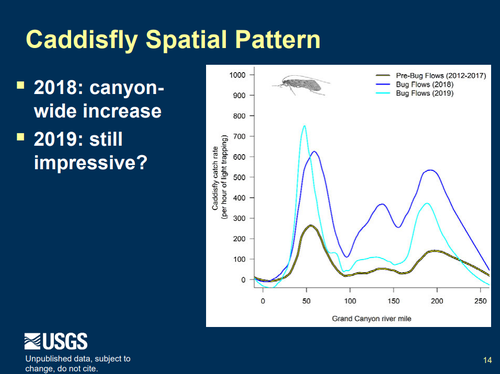
| − | + | [[File:2019 caddis pattern.PNG|thumb|center|500px| [https://www.usbr.gov/uc/progact/amp/twg/2020-01-13-twg-meeting/20200113-AnnualReportingMeeting-Year2BugFlows-Presentation-508-UCRO.pdf| https://www.usbr.gov/uc/progact/amp/twg/2020-01-13-twg-meeting/20200113-AnnualReportingMeeting-Year2BugFlows-Presentation-508-UCRO.pdf] ]] | |
| − | + | ||
| − | + | ||
| − | + | ||
| − | + | ||
| − | + | |- | |
| + | ! <h2 style="margin:0; background:#cedff2; font-size:120%; font-weight:bold; border:1px solid #a3b0bf; text-align:left; color:#000; padding:0.2em 0.4em;"> Primary causal mechanism </h2> | ||
| + | |- | ||
| + | |style="color:#000;"| | ||
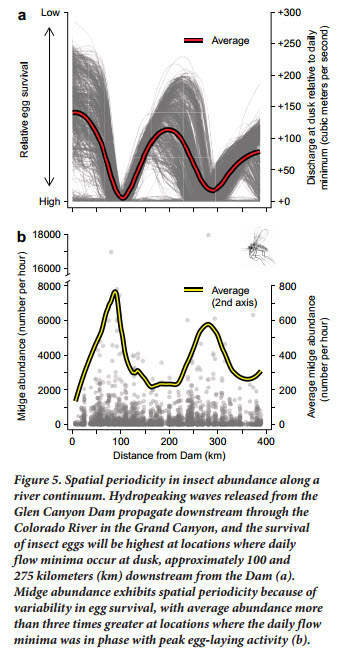
| − | + | '''Hypothesis:''' Daily flow fluctuations dry (desiccate) and kill eggs laid in the evening along the shorelines resulting in population level declines in the abundance and diversity of aquatic macroinvertebrates (midges and EPT) below Glen Canyon Dam. <br> | |
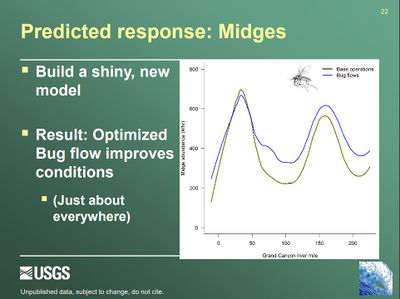
| − | + | '''Questions:''' Will bugflows increase the abundance and diversity of aquatic macroinvertebrates (midges and EPT) below Glen Canyon Dam? | |
| − | * | + | *In areas where evening egg laying is out of sync with the daily hydropower wave (Glen Canyon, Upper and Lower Granite Gorge), can we detect increased egg laying and egg survival during the low weekend flow? |
| − | * | + | *If observed, does increased egg laying and survival translate into increased larval and adult abundance and diversity? |
| − | * | + | *Additionally, steady flows are know to reduce aquatic macroinvertebrate drift. Do increases in production and diversity, if observed, compensate for any decrease in drift? <br> |
| − | + | [[File:MidgeAbundanceFlow.jpg|thumb|center|400px| [http://gcdamp.com/images_gcdamp_com/7/70/Kennedy_2016_HydropowerEPT.pdf BioScience Paper] ]] | |
| − | + | [[File:BugflowsPrediction.JPG|thumb|center|400px| [https://www.usbr.gov/uc/progact/amp/twg/2018-01-25-twg-meeting/AR10.pdf https://www.usbr.gov/uc/progact/amp/twg/2018-01-25-twg-meeting/AR10.pdf] ]] | |
| + | |- | ||
| + | ! <h2 style="margin:0; background:#cedff2; font-size:120%; font-weight:bold; border:1px solid #a3b0bf; text-align:left; color:#000; padding:0.2em 0.4em;"> How are Bugflows going to be monitored? </h2> | ||
| + | |- | ||
| + | |style="color:#000;"| | ||
| + | |||
| + | *[https://www.usgs.gov/centers/sbsc/science/citizen-science-light-trapping-grand-canyon?qt-science_center_objects=0#qt-science_center_objects Citizen Science light trap monitoring throughout Glen and Grand Canyons] | ||
| + | *Drift: every 5 miles in Glen and Grand Canyons | ||
| + | *Weekday vs weekend drift | ||
| + | |||
| + | |- | ||
| + | ! <h2 style="margin:0; background:#cedff2; font-size:120%; font-weight:bold; border:1px solid #a3b0bf; text-align:left; color:#000; padding:0.2em 0.4em;"> How will we know if Bugflows are successful? </h2> | ||
| + | |- | ||
| + | |style="color:#000;"| | ||
| + | |||
| + | *See a smoothing of the spatial pattern in midges in Grand Canyon | ||
| + | *Increase in midges throughout Glen and Grand Canyons | ||
| + | *Increase in caddisflies (and other EPT) throughout Glen and Grand Canyons | ||
|} | |} | ||
| Line 81: | Line 93: | ||
|style="color:#000;"| | |style="color:#000;"| | ||
| − | + | [http://gcdamp.com/index.php?title=FOOD_BASE Food Base Page] | |
| + | [http://gcdamp.com/index.php?title=%27%27%27Oviposition_and_Egg_Desiccation%27%27%27 Oviposition and Egg Desiccation Studies] | ||
| + | |||
| + | [http://gcdamp.com/index.php?title=Foodwebs_and_Bioenergetics Foodwebs and Bioenergetics Studies] | ||
| + | |||
| + | [https://www.gcmrc.gov/research_areas/food_base/primary_production.aspx Measuring Primary Production in the Lees Ferry Reach] | ||
| + | |||
| + | Effects of [http://gcdamp.com/index.php?title=The_Bugflow_Experiment BugFlows] and [http://gcdamp.com/index.php?title=The_HFE_Page HFEs] on the Aquatic Foodbase | ||
| + | *[https://www.usgs.gov/centers/sbsc/science/citizen-science-light-trapping-grand-canyon?qt-science_center_objects=0#qt-science_center_objects Citizen Science Insect Monitoring] | ||
| + | |||
| + | Hyporheic anoxia in the Lees Ferry Reach | ||
| + | |||
| + | Substrate condition and availability for EPT below Glen Canyon Dam | ||
| + | |||
| + | Downstream Recovery of the Foodbase Community in Several Colorado River Tailwaters | ||
| + | |||
| + | Drift and Food Availability Studies | ||
| + | *[https://www.gcmrc.gov/research_areas/food_base/invertebrate_drift.aspx Invertebrate Drift below Glen Canyon Dam ] | ||
| + | *[http://www.usu.edu/buglab/Projects/CurrentProjects/#item=33 Responses of macroinvertebrate drift, benthic assemblages and trout foraging to hydropeaking below Flaming Gorge Dam] | ||
| + | |||
| + | |- | ||
| + | ! <h2 style="margin:0; background:#cedff2; font-size:120%; font-weight:bold; border:1px solid #a3b0bf; text-align:left; color:#000; padding:0.2em 0.4em;"> Resources that might be affected </h2> | ||
| + | |- | ||
| + | |style="color:#000;"| | ||
| + | |||
| + | *Foodbase: abundance, diversity, availability (drift) | ||
| + | *Hydropower: value, capacity | ||
| + | *Trout and native fisheries: production, condition | ||
| + | *Lees Ferry fishery: access, economics | ||
| + | *Boater safety: Glen Canyon, downstream | ||
| + | *Sediment transport: beaches | ||
| + | |||
| + | |- | ||
| + | ! <h2 style="margin:0; background:#cedff2; font-size:120%; font-weight:bold; border:1px solid #a3b0bf; text-align:left; color:#000; padding:0.2em 0.4em;"> Financial costs of the experiment </h2> | ||
| + | |- | ||
| + | |style="color:#000;"| | ||
| + | |||
| + | *The cost of the 2018 Bugflow Experiment was $165,000 [https://publications.anl.gov/anlpubs/2019/06/151429.pdf] <br> | ||
| + | *The cost of the 2019 Bugflow Experiment was $327,000 [https://publications.anl.gov/anlpubs/2020/12/163982.pdf] <br> | ||
| + | *The cost of the 2020 Bugflow Experiment was $941,000 [[Media:2020BugFlowsFinancials.pdf| (3)]]<br> | ||
| + | The three-year (2018-2020) total of doing the Bugflow Experiment is $1,433,000 <br> | ||
| + | |||
| + | *The cost estimate for doing a Bugflow Experiment in 2021 (which wasn't implemented) was $1,021,000 <br> | ||
| + | *The cost of the 2022 Bugflow Experiment was $1,154,000 [https://publications.anl.gov/anlpubs/2019/06/151429.pdf] <br> | ||
| + | |||
| + | |- | ||
| + | ! <h2 style="margin:0; background:#cedff2; font-size:120%; font-weight:bold; border:1px solid #a3b0bf; text-align:left; color:#000; padding:0.2em 0.4em;"> Possible confounding factors </h2> | ||
| + | |- | ||
| + | |style="color:#000;"| | ||
| + | |||
| + | *Tributary inflows make mainstem flows anything but "steady" through Grand Canyon | ||
| + | *Changes in nutrients, turbidity, and temperature are also thought to be strong drivers of macroinvertebrate production | ||
| + | *Bugflows may have a compounding affect on production that may not be seen for many bug generations (months to years) | ||
|- | |- | ||
| Line 89: | Line 153: | ||
|style="color:#000;"| | |style="color:#000;"| | ||
| + | '''2023''' | ||
| + | *[https://www.usbr.gov/uc/progact/amp/twg/2023-04-13-twg-meeting/20230413-BugsPayDaysSteadyReservoirReleases-508-UCRO.pdf Bugs pay for days of steady reservoir releases] | ||
| + | *[https://www.usbr.gov/uc/progact/amp/amwg/2023-02-16-amwg-meeting/20230216-ScienceUpdateLakePowellRiparianVegetationBugFlows-508-UCRO.pdf Science Update: Lake Powell, Riparian Vegetation, and Bug Flows] | ||
| + | *[[Media:Kennedy JuneTWG for BAO.pdf| Experimental Bug Flows Enhance Natural Processes That Sustain The Colorado River Ecosystem]] | ||
| + | *[[Media:1100_TWGQnA_bugflow_20230615.pdf| Bugflows Q&A]] | ||
| + | *[https://www.usbr.gov/uc/progact/amp/twg/2023-01-26-twg-meeting/20230126-AnnualReportingMeeting-BugFlowsFoodBaseUpdate-508-UCRO.pdf Project F: Bug Flows and food base update] | ||
| + | |||
| + | '''2022''' | ||
| + | *[https://www.usbr.gov/uc/progact/amp/amwg/2022-08-18-amwg-meeting/20220818-Kennedy_Update_Bug_Flow_AMWG_BAO_508.pdf Update on the Bug Flow Experiment: Background, Monitoring, and New Analyses] | ||
| + | *[[Media:Decision Memo on Bug Flows 2022 08 12.pdf| August 2022 BugFlow Decision memo]] | ||
| + | *[[Media:Summary Bug Flow Tech Analyses and Comments 2022 08 12.pdf| August 2022 Summary Bug Flow Tech Analyses and Comments ]] | ||
| + | *[[Media:2022_BugFlow_Decision_memo_Final_wgp.pdf| April 2022 BugFlow Decision memo]] | ||
| + | *[[Media:2022.04.11 - Technical Recommendation Report - Bug Flows 2022 - FINAL wAttach - Copy.pdf| April 2022 Technical Recommendation Report]] | ||
| + | *[https://www.usbr.gov/uc/progact/amp/twg/2022-01-13-twg-meeting/20220113-AnnualReportingMeeting-DiscussionBugFlowsSynthesisReviewOpportunitiesSpringSummerFlowExperiments-508-UCRO.pdf Discussion of the Bug Flows Synthesis and Review & Opportunities for Spring and Summer Flow Experiments ] | ||
| + | *[https://www.usbr.gov/uc/progact/amp/amwg/2022-05-18-amwg-meeting/20220518-BugFlowsFY2022-508-UCRO.pdf Bug Flows FY2022 ] | ||
| + | |||
| + | '''2021''' | ||
| + | *[https://www.usbr.gov/uc/progact/amp/twg/2021-10-14-twg-meeting/20211014-MacroInvertebrateFlowExperimentFinancialImpactHydropower-Presentation-508-UCRO.pdf Macro Invertebrate Flow Experiment Financial Impact on Hydropower: Process and Methods] | ||
| + | *[https://www.usbr.gov/uc/progact/amp/twg/2021-04-14-twg-meeting/20210414-DiscussionAnticipatedScopeForthcomingBugFlowEvaluationDocument-508-UCRO.pdf Discussion of the Anticipated Scope of the Forthcoming Bug Flow Evaluation Document ] | ||
| + | *[https://www.usbr.gov/uc/progact/amp/twg/2021-01-22-twg-meeting/20210122-BugFlows-508-UCRO.pdf Bug Flows ] | ||
| + | |||
| + | '''2020''' | ||
| + | *[[Media:2020BugFlowsFinancials.pdf| Financial Analysis of the 2020 Glen Canyon Dam Bug Flow Experiment]] | ||
| + | *[https://www.usbr.gov/uc/progact/amp/twg/2020-10-15-twg-meeting/20201015-UpdateBugFlowsExperiment-Presentation-508-UCRO.pdf Update on the Bug Flows Experiment ] | ||
| + | *[https://www.usbr.gov/uc/progact/amp/amwg/2020-08-20-amwg-meeting/20200820-WY20LTEMPExp-AugAMWG.pdf Potential Water Year 2021 LTEMP Experiments & Bug Flow Update] | ||
| + | *[https://www.usbr.gov/uc/progact/amp/amwg/2020-05-20-amwg-meeting/20200520-AMWG-PotentialWaterYear2020LTEMPExperimentsBugFlowUpdate-508-UCRO.pdf Potential Water Year 2020 LTEMP Experiments & Bug Flow Update ] | ||
| + | *[https://www.usbr.gov/uc/progact/amp/twg/2020-04-15-twg-meeting/20200415-BugFlowsMonitoringResults-Presentation-508-UCRO.pdf Bug Flows Monitoring Results ] | ||
| + | *[https://www.usbr.gov/uc/progact/amp/amwg/2020-02-12-amwg-meeting/20200212-GCMRC2020AnnualReportingMeeting-PresentationPart1-508-UCRO.pdf GCMRC 2019 Annual Reporting Meeting Overview – Part 1 ] | ||
| + | *[https://www.knau.org/post/colorado-river-bugs-spark-two-unprecedented-experiments-opposite-goals Colorado River Bugs Spark Two Unprecedented Experiments With Opposite Goals] | ||
| + | *[https://www.usbr.gov/newsroom/newsrelease/detail.cfm?RecordID=70708 Water experiment to be conducted along the Colorado River while maintaining hydropower production this summer] | ||
| + | *[[Media:2020-04-24 ASWS Approval Memo on Implementing Bug Flows.pdf| Approval of recommendation for macroinvertebrate production flow releases at Glen Canyon Dam, May 1 through August, 2020]] | ||
| + | *[[Media:Attachment - FINAL 2020 GCD Planning Implementation Team Bug Flows Recommendation Report.pdf| 2020 GCD Planning Implementation Team Bug Flows Recommendation Report]] | ||
| + | *[[Media:Metcalf etal 2020 Bug flows Don't count your midges-BQR article.pdf |Metcalfe et. al., 2020, Bug flows--Don't count your midges until they hatch: Boatman's Quarterly Review]] | ||
| + | *[https://www.usbr.gov/uc/progact/amp/twg/2020-01-13-twg-meeting/20200113-AnnualReportingMeeting-TroutRecruitmentGrowthPopulationDynamics-Presentation-508-UCRO.pdf TRGD: Trout Recruitment, Growth and Population Dynamics ] | ||
| + | *[https://www.usbr.gov/uc/progact/amp/twg/2020-01-13-twg-meeting/20200113-AnnualReportingMeeting-Year2BugFlows-Presentation-508-UCRO.pdf Year 2 of Bug Flows ] | ||
| + | |||
| + | '''2019''' | ||
| + | *[[Media:2019BugFlowsFinancials.pdf| Financial Analysis of the 2019 Glen Canyon Dam Bug Flow Experiment]] | ||
| + | *[[Media:2019-04-24 ASWS Decision Memo on Implementing Bug Flows.pdf| ASWS Decision Memo on Implementing Bug Flows]] | ||
| + | *[[Media:2019 GCD Planning Implementation Team Bug Flows Recommendation Report final.pdf| 2019 GCD Planning Implementation Team Bug Flows Recommendation Report]] | ||
| + | *[[Media:2019-04-19 GCD Planning Implementation Team Bug Flows Recommendation to GCD Leadership Team.pdf| GCD Planning Implementation Team Bug Flows Recommendation to GCD Leadership Team]] | ||
| + | *[https://www.usbr.gov/uc/progact/amp/twg/2019-03-14-twg-meeting/20190314-BugFlowsImplementationResourceResponse-Presentation-508-UCRO.pdf Bug Flows Implementation and Resource Response Presentation ] | ||
| + | *[https://www.usbr.gov/uc/progact/amp/amwg/2019-03-06-amwg-meeting/20190306-ModelingInputBugflowExperimentSummer2018-Presentation-508-UCRO.pdf Modeling Input for the Bugflows Experiment - Summer, 2018 Presentation] | ||
| + | *[https://www.usbr.gov/uc/progact/amp/twg/2019-03-14-twg-meeting/20190314-BugFlowsImplementationResourceResponse-Presentation-508-UCRO.pdf Bug Flows Implementation and Resource Response Presentation ] | ||
| + | |||
| + | '''2018''' | ||
| + | *[https://publications.anl.gov/anlpubs/2019/06/151429.pdf Financial Analysis of the 2018 Glen Canyon Dam Bug Flow Experiment] | ||
| + | *[https://www.usbr.gov/uc/progact/amp/amwg/2018-08-22-amwg-meeting/Attach_05.pdf Do bug flows result in better fishing? PPT] | ||
| + | *[https://www.usbr.gov/uc/progact/amp/amwg/2018-08-22-amwg-meeting/Attach_04.pdf Update on the Progress of the Bug Flow Experiment PPT ] | ||
| + | *[https://www.usbr.gov/uc/progact/amp/amwg/2018-05-22-amwg-meeting/Attach_06.pdf Approval of Recommendation for Macroinvertebrate Production Flow Releases at Glen Canyon Dam, May 1 through August 31, 2018] | ||
| + | *[[Media:2018 BugFlow memo - ASWS signature.pdf| 2018 BugFlow memo]] | ||
| + | *[[Media:2018 GCD Experimental Technical Team Report final.pdf| 2018 GCD Experimental Technical Team Report - Bugflows]] | ||
| + | *[https://www.usbr.gov/uc/progact/amp/twg/2018-01-25-twg-meeting/AR10.pdf Bug flow optimizations and predictions PPT] | ||
| + | |||
| + | '''2016''' | ||
*[[Media:Kennedy 2016 HydropowerEPT.pdf| Kennedy et al. 2016. Flow Management for Hydropower Extirpates Aquatic Insects, Undermining River Food Webs. BioScience]] | *[[Media:Kennedy 2016 HydropowerEPT.pdf| Kennedy et al. 2016. Flow Management for Hydropower Extirpates Aquatic Insects, Undermining River Food Webs. BioScience]] | ||
| + | *[https://undark.org/article/wilo-doyle-colorado-river-insects/ Deep in the Grand Canyon, Scientists Struggle to Bring Back the Bugs] | ||
| + | *[https://www.nytimes.com/aponline/2018/04/30/us/ap-us-colorado-river-bugs.html Scientists Hope Bug Experiment Fattens Colorado River Fish (NY Times)] | ||
| + | *[http://azdailysun.com/news/local/scientists-hope-bug-experiment-fattens-colorado-river-fish/article_323d902e-db1f-560e-a20c-2b5b0b8ae245.html#tracking-source=home-latest-2 Scientists hope bug experiment fattens Colorado River fish (AZ Daily Sun)] | ||
| + | *[https://www.wapa.gov/newsroom/NewsFeatures/2018/Pages/bug-flows.aspx Bugging out for fish (WAPA)] | ||
| + | |||
| + | |- | ||
| + | ! <h2 style="margin:0; background:#cedff2; font-size:120%; font-weight:bold; border:1px solid #a3b0bf; text-align:left; color:#000; padding:0.2em 0.4em;">LTEMP descriptions</h2> | ||
| + | |- | ||
| + | |style="color:#000;"| | ||
| + | |||
| + | ==The Bugflow Experiment: [http://ltempeis.anl.gov/documents/final-eis/vol1/Chapter_2-Alternatives.pdf (Chapter 2 LTEMP EIS, Page 71)]== | ||
| + | |||
| + | A more diverse and productive aquatic food base could benefit a variety of priority | ||
| + | resources, including native fish (including the endangered humpback chub), the rainbow trout | ||
| + | fishery, and other riparian species that occur in Glen, Marble, and Grand Canyons. Mayflies | ||
| + | (Ephemeroptera), stoneflies (Plecoptera), and caddisflies (Trichoptera), collectively referred to as | ||
| + | EPT, are important components of a healthy aquatic food base, but they are notably absent from | ||
| + | the Glen and Marble Canyon reaches and very low in abundance and diversity in the Grand | ||
| + | Canyon. GCMRC has hypothesized that EPT taxa are recruitment limited, because daily flow | ||
| + | fluctuations to meet hydropower demand cause high egg mortality, and the absence of EPT has | ||
| + | an adverse effect on the carrying capacity and condition of the trout fishery and native fish | ||
| + | communities. EPT are thought to be recruitment limited because Glen Canyon Dam fluctuations | ||
| + | create a large varial (intermittently wetted) zone along shorelines. Because the Colorado River in | ||
| + | Glen, Marble, and Grand Canyons is canyon-bound and the tributaries that join the river all have | ||
| + | comparatively low flow, the size of the varial zone does not appreciably decrease with distance | ||
| + | downstream. Thus, although water temperature regimes become more naturalized with distance | ||
| + | downstream, the effect that daily flow fluctuations to meet hydropower demand have on the | ||
| + | stability of shoreline habitat does not attenuate much with distance from the dam. | ||
| + | |||
| + | This hypothesis attributes the absence of EPT and the poor health of the invertebrate | ||
| + | assemblage to the width of the varial zone, similar to earlier investigations (Blinn et al. 1995), | ||
| + | but focuses on the effects unstable shorelines have on the eggs of these species. This hypothesis | ||
| + | assumes that egg-laying by EPT occurs principally along shorelines. According to the | ||
| + | hypothesis, EPT taxa downstream of Glen Canyon Dam are recruitment limited, because daily | ||
| + | flow fluctuations to meet hydropower demand negatively affect habitat quality along the | ||
| + | shorelines where egg laying is assumed to occur. | ||
| + | |||
| + | To test this hypothesis, macroinvertebrate production flows would be provided every | ||
| + | weekend from May through August (34 days total). The flow on weekends would be held | ||
| + | steady at the minimum flow for that month, which would ensure that the insect eggs laid during | ||
| + | weekends would remain submerged throughout larval development. If the hypothesis is true, | ||
| + | there would be an increase in insect production due to the reproductive success of insects that | ||
| + | laid eggs during weekends. No change in monthly volumes, ramping rates, or the maximum | ||
| + | daily range in flow during weekdays would be required for this experiment. To offset the smaller | ||
| + | water releases that would occur during weekends within a given month, larger releases would | ||
| + | need to occur during the weekdays within a given month. | ||
| + | |||
| + | Implementation of macroinvertebrate production flows would consider resource | ||
| + | condition assessments and resource concerns using the processes described in Sections 2.2.4.3 | ||
| + | and 2.2.4.4. These flows may not be tested when there appears to be the potential for | ||
| + | unacceptable impacts on the resources listed in Section 2.2.4.3. | ||
| + | |||
| + | Effects of the tests would be evaluated using observation to determine the location where | ||
| + | insect eggs are deposited and the emergence rates of species. Depending on the outcome of the | ||
| + | tests, the experiment could be discontinued if there were unacceptable effects on other resources. | ||
| + | There is also the possibility that implementation would result in confounding interactions with | ||
| + | TMF experiments, and this will be discussed during the communication and consultation process | ||
| + | as described in Section 2.2.4.4. | ||
| + | |||
| + | Target two to three replicates (Table 2-9, Page 2-54). | ||
| + | |||
| + | ==[https://www.fws.gov/southwest/es/arizona/Documents/Biol_Opin/120059_LTEMP%20BiOp_11-25-16.pdf LTEMP Biological Assessment, pages 30-41 ]== | ||
| + | Low steady weekend flows (“Macroinvertebrate Production Flows”) would be conducted to test whether the | ||
| + | flows would increase insect abundance. On an experimental basis, for example, | ||
| + | flows would be held low and steady for two days per week (weekends) from May | ||
| + | through August to attempt to improve the productivity of the aquatic food base, | ||
| + | and increase the diversity and abundance of mayflies (Ephemeroptera), stoneflies | ||
| + | (Plecoptera), and caddisflies (Trichoptera), which are collectively referred to as | ||
| + | EPT. | ||
|- | |- | ||
| Line 96: | Line 284: | ||
|style="color:#000;"| | |style="color:#000;"| | ||
| + | [[File:BugflowHydrograph.jpg|thumb|center|400px|Example of an experimental Macroinvertebrate Production Flow (MPF) hydrograph]] | ||
| − | + | ==Modeling Assumptions:== | |
| + | *Macroinvertebrate Production Flows (MPFs) would occur every weekend from May - Aug (34 days, we scheduled July to have the 5th weekend because that how it works out in 2016) | ||
| + | *Weekend flow = minimum flow for the month = weekday minimum flow (see weekly hydrographs on the monthly tabs) | ||
| + | *Hybrid Public Draft monthly volume, ramp rates, or daily change parameters | ||
| + | *Moved weekend water to weekday releases | ||
| + | *Energy prices used in this modeling are for a Saturday, Sunday, and a weekday for May, June, July, and August 2016. These are the energy prices Argonne used in the LTEMP modeling for 2016. | ||
| + | Hybrid Public Draft 8.23 MAF volumes: | ||
| + | *May = 632 | ||
| + | *June = 663 | ||
| + | *July = 749 | ||
| + | *August = 800 | ||
| − | + | Ramp rates: 4,000 up and 2,500 down | |
| + | |||
| + | Daily change: | ||
| + | *May = 9 | ||
| + | *June = 10 | ||
| + | *July = 10 | ||
| + | *August = 10 | ||
| + | |||
| + | Minimum release: 5,000 cfs <br> | ||
| + | Maximum release: 25,000 cfs | ||
| + | |||
| + | |} | ||
Latest revision as of 11:56, 7 December 2023
|
|
What is the “Macroinvertebrate Production Flow (MPF)" or "Bug Flow" experiment? Bugflows were implemented May-August in 2018, 2019, 2020, and 2022. |
| EPT as Biologic Indicators of Stream Condition |
Algae and Aquatic Macrophytes |
Aquatic Macroinvertebrates |
|---|
|
|
