Difference between revisions of "The Bugflow Experiment"
Cellsworth (Talk | contribs) |
Cellsworth (Talk | contribs) |
||
| Line 32: | Line 32: | ||
----------Strapline immediately below banner----------> | ----------Strapline immediately below banner----------> | ||
{| style="width:100%; height:50px" border=1px solid #ccc; background:#cedff2 | {| style="width:100%; height:50px" border=1px solid #ccc; background:#cedff2 | ||
| − | ! style="width=33%; background:#cedff2;" | [[ | + | ! style="width=33%; background:#cedff2;" | [[File:EPT.jpg|center|500px]] [https://www.wcc.nrcs.usda.gov/ftpref/wntsc/strmRest/wshedCondition/EPTIndex.pdf EPT as Biologic Indicators of Stream Condition] <br> |
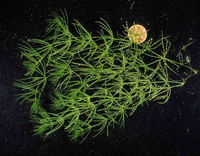
| − | ! style="width=33%; background:#cedff2;" | [[ | + | ! style="width=33%; background:#cedff2;" | [[File:Chara.jpg|center|200px]] [[Algae and Aquatic Macrophytes]] <br> |
| − | ! style="width=55%; background:#cedff2;" | [[ | + | ! style="width=55%; background:#cedff2;" | [[File:Macroinvertebrates.jpg|center|400px]] [http://extension.usu.edu/waterquality/macrokey/ Aquatic Macroinvertebrates] <br> |
|} | |} | ||
| Line 40: | Line 40: | ||
|class="MainPageBG" style="width:65%; border:1px solid #cef2e0; background:#f5faff; vertical-align:top; color:#000;"| | |class="MainPageBG" style="width:65%; border:1px solid #cef2e0; background:#f5faff; vertical-align:top; color:#000;"| | ||
{|width="100%" cellpadding="2" cellspacing="5" style="vertical-align:top; background:#f5faff;" | {|width="100%" cellpadding="2" cellspacing="5" style="vertical-align:top; background:#f5faff;" | ||
| − | ! <h2 style="margin:0; background:#cedff2; font-size:120%; font-weight:bold; border:1px solid #a3bfb1; text-align:left; color:#000; padding:0.2em 0.4em;"> | + | ! <h2 style="margin:0; background:#cedff2; font-size:120%; font-weight:bold; border:1px solid #a3bfb1; text-align:left; color:#000; padding:0.2em 0.4em;"> The Bugflow Experiment: [http://ltempeis.anl.gov/documents/final-eis/vol1/Chapter_2-Alternatives.pdf (Chapter 2 LTEMP EIS, Page 71)] </h2> |
|- | |- | ||
|style="color:#000;"| | |style="color:#000;"| | ||
| − | |||
| − | |||
| − | |||
| − | |||
| − | |||
| − | |||
| − | |||
| − | |||
| − | |||
| − | |||
A more diverse and productive aquatic food base could benefit a variety of priority | A more diverse and productive aquatic food base could benefit a variety of priority | ||
| Line 101: | Line 91: | ||
as described in Section 2.2.4.4. | as described in Section 2.2.4.4. | ||
| − | ==[https://www. | + | |- |
| − | + | ! <h2 style="margin:0; background:#cedff2; font-size:120%; font-weight:bold; border:1px solid #a3b0bf; text-align:left; color:#000; padding:0.2em 0.4em;"> Primary causal mechanism: </h2> | |
| − | + | |- | |
| − | + | |style="color:#000;"| | |
| − | + | ||
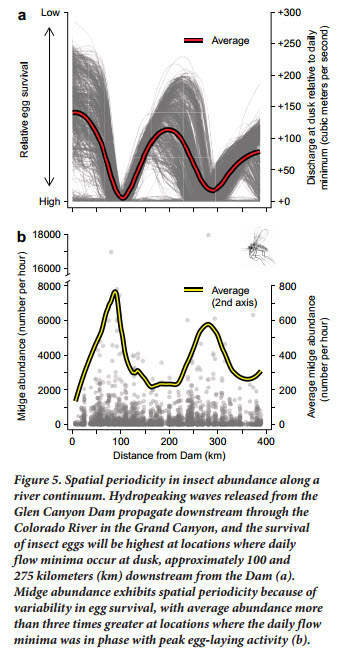
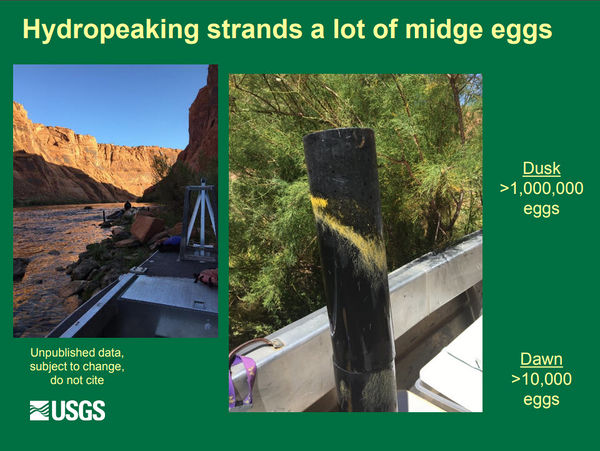
| − | + | Daily flow fluctuations dry and kill eggs laid in the evening along the shorelines. <br> | |
| − | ( | + | [[File:MidgeAbundanceFlow.jpg|thumb|center|400px| [http://gcdamp.com/images_gcdamp_com/7/70/Kennedy_2016_HydropowerEPT.pdf BioScience Paper] ]] |
| − | EPT | + | [[File:MidgeEggStranding.jpg|thumb|center|600px|https://www.usbr.gov/uc/rm/amp/twg/mtgs/17jan26/AR19_Kennedy.pdf]] |
| + | |||
| + | |- | ||
| + | ! <h2 style="margin:0; background:#cedff2; font-size:120%; font-weight:bold; border:1px solid #a3b0bf; text-align:left; color:#000; padding:0.2em 0.4em;"> How are Bugflows going to be monitored? </h2> | ||
| + | |- | ||
| + | |style="color:#000;"| | ||
| + | |||
| + | *[https://www.gcmrc.gov/research_areas/food_base/citizen_science_monitoring.aspx Citizen Science light trap monitoring: throughout Glen and Grand Canyons] | ||
| + | *Drift: every 2 miles in Glen and Grand Canyons | ||
| + | *Artificial egg-laying substrates?? | ||
| + | |||
| + | |- | ||
| + | ! <h2 style="margin:0; background:#cedff2; font-size:120%; font-weight:bold; border:1px solid #a3b0bf; text-align:left; color:#000; padding:0.2em 0.4em;"> How will we know if Bugflows are successful? </h2> | ||
| + | |- | ||
| + | |style="color:#000;"| | ||
| + | |||
| + | *See an increase in the mean midge abundance (number caught/hr) in citizen scientist light trapping where midge abundance has historically been low (Glen Canyon, Upper Granite Gorge, Lower Granite Gorge) | ||
| + | *See an increase in EPT production in the mainstem with larvae being caught in mainstem drift | ||
| + | *See an increase in EPT egg laying on artificial substrates in the mainstem | ||
|} | |} | ||
| Line 122: | Line 130: | ||
|style="color:#000;"| | |style="color:#000;"| | ||
| − | + | [http://gcdamp.com/index.php?title=FOOD_BASE Food Base Page] | |
| + | |||
| + | [http://gcdamp.com/index.php?title=%27%27%27Oviposition_and_Egg_Desiccation%27%27%27 Oviposition and Egg Desiccation Studies] | ||
| + | |||
| + | [http://gcdamp.com/index.php?title=Foodwebs_and_Bioenergetics Foodwebs and Bioenergetics Studies] | ||
| + | |||
| + | [https://www.gcmrc.gov/research_areas/food_base/primary_production.aspx Measuring Primary Production in the Lees Ferry Reach] | ||
| + | |||
| + | Effects of [http://gcdamp.com/index.php?title=The_Bugflow_Experiment BugFlows] and [http://gcdamp.com/index.php?title=The_HFE_Page HFEs] on the Aquatic Foodbase | ||
| + | *[https://www.gcmrc.gov/research_areas/food_base/citizen_science_monitoring.aspx Citizen Science Insect Monitoring] | ||
| + | |||
| + | Hyporheic anoxia in the Lees Ferry Reach | ||
| + | |||
| + | Substrate condition and availability for EPT below Glen Canyon Dam | ||
| + | |||
| + | Downstream Recovery of the Foodbase Community in Several Colorado River Tailwaters | ||
| + | |||
| + | Drift and Food Availability Studies | ||
| + | *[https://www.gcmrc.gov/research_areas/food_base/invertebrate_drift.aspx Invertebrate Drift below Glen Canyon Dam ] | ||
| + | *[http://www.usu.edu/buglab/Projects/CurrentProjects/#item=33 Responses of macroinvertebrate drift, benthic assemblages and trout foraging to hydropeaking below Flaming Gorge Dam] | ||
| + | |||
| + | |- | ||
| + | ! <h2 style="margin:0; background:#cedff2; font-size:120%; font-weight:bold; border:1px solid #a3b0bf; text-align:left; color:#000; padding:0.2em 0.4em;"> Other resources that might be affected </h2> | ||
| + | |- | ||
| + | |style="color:#000;"| | ||
| + | |||
| + | *Hydropower: value, capacity | ||
| + | *Trout and native fisheries: production, condition | ||
| + | *Lees Ferry fishery: access, economics | ||
| + | *Boater safety: Glen Canyon, downstream | ||
| + | *Sediment transport: beaches | ||
| + | |||
| + | |- | ||
| + | ! <h2 style="margin:0; background:#cedff2; font-size:120%; font-weight:bold; border:1px solid #a3b0bf; text-align:left; color:#000; padding:0.2em 0.4em;"> Possible confounding factors </h2> | ||
| + | |- | ||
| + | |style="color:#000;"| | ||
| + | |||
| + | *Tributary inflows make mainstem flows anything but "steady" through Grand Canyon | ||
| + | *Changes in nutrients, turbidity, and temperature are also thought to be strong drivers of macroinvertebrate production | ||
| + | *Bugflows may have a compounding affect on production that may not be seen for many bug generations (months to years) | ||
|- | |- | ||
| Line 137: | Line 184: | ||
|style="color:#000;"| | |style="color:#000;"| | ||
| − | Modeling Assumptions: | + | ==[https://www.fws.gov/southwest/es/arizona/Documents/Biol_Opin/120059_LTEMP%20BiOp_11-25-16.pdf LTEMP Biological Assessment, pages 30-41 ]== |
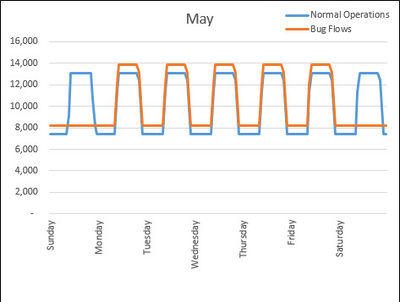
| + | Low steady weekend flows (“Macroinvertebrate Production Flows”) would be conducted to test whether the | ||
| + | flows would increase insect abundance. On an experimental basis, for example, | ||
| + | flows would be held low and steady for two days per week (weekends) from May | ||
| + | through August to attempt to improve the productivity of the aquatic food base, | ||
| + | and increase the diversity and abundance of mayflies (Ephemeroptera), stoneflies | ||
| + | (Plecoptera), and caddisflies (Trichoptera), which are collectively referred to as | ||
| + | EPT. | ||
| + | |||
| + | ==Modeling Assumptions:== | ||
*Macroinvertebrate Production Flows (MPFs) would occur every weekend from May - Aug (34 days, we scheduled July to have the 5th weekend because that how it works out in 2016) | *Macroinvertebrate Production Flows (MPFs) would occur every weekend from May - Aug (34 days, we scheduled July to have the 5th weekend because that how it works out in 2016) | ||
*Weekend flow = minimum flow for the month = weekday minimum flow (see weekly hydrographs on the monthly tabs) | *Weekend flow = minimum flow for the month = weekday minimum flow (see weekly hydrographs on the monthly tabs) | ||
Revision as of 15:13, 15 March 2018
|
|
What is the “Macroinvertebrate Production Flow (MPF)" experiment? |
| EPT as Biologic Indicators of Stream Condition |
Algae and Aquatic Macrophytes |
Aquatic Macroinvertebrates |
|---|
|
|


