Difference between revisions of "2017 Knowledge Assessment"
Cellsworth (Talk | contribs) |
Cellsworth (Talk | contribs) |
||
| Line 58: | Line 58: | ||
management objectives and, if the current condition shows any trend, is this a trend | management objectives and, if the current condition shows any trend, is this a trend | ||
toward or away from management objectives? | toward or away from management objectives? | ||
| − | [[File: | + | [[File:StatusTrendResource.jpg|center|350px]] |
=='''Drivers and Constraints''' == | =='''Drivers and Constraints''' == | ||
| Line 65: | Line 65: | ||
effects, and do these effects constrain or drive resource condition toward or away from | effects, and do these effects constrain or drive resource condition toward or away from | ||
management objectives? | management objectives? | ||
| − | [[File: | + | |
| + | Appendix C presents the complete set of graphic results for the drivers and constraints identified | ||
| + | for each resource topic, averaged for each resource characteristic. Unfortunately, there is no | ||
| + | simple way to summarize these results. As explained earlier (see Roll-Up Method, above), it is | ||
| + | not meaningful to average the rating values for the drivers and constraints affecting an entire | ||
| + | resource topic across all associated resource characteristics. In addition, each expert team | ||
| + | independently developed its own list of drivers and constraints. This produced a total of 88 | ||
| + | different driver and constraint names, with no two expert teams using the same names for any | ||
| + | drivers and constraints. As a result, it is not possible to directly compare the ratings for | ||
| + | individual drivers across resource topics. | ||
| + | |||
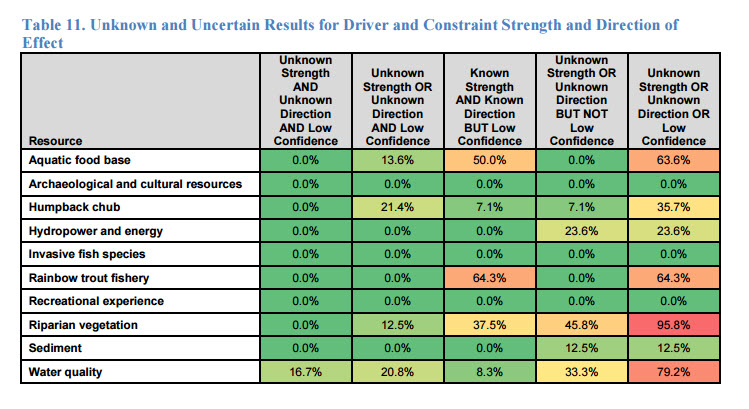
| + | However, it is possible to organize the 88 drivers and constraints into a smaller number of | ||
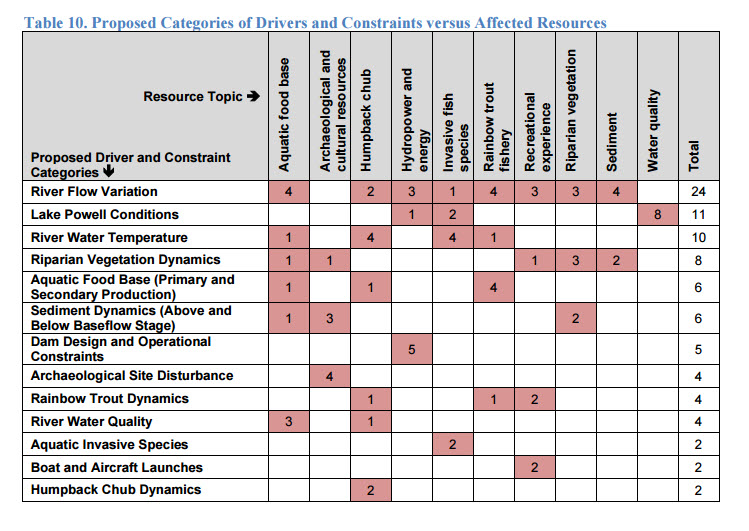
| + | categories. Table 10 identifies 13 categories or types of drivers and constraints, incorporating all | ||
| + | 88 original “raw” types identified by the ten expert teams (see Appendix C). Other groupings are | ||
| + | possible (see Recommendations, below). Table 10 also shows the numbers of individual drivers | ||
| + | and constraints in each category, both overall and for each affected resource. Table 10 lists the | ||
| + | proposed driver/constraint categories in order based on their overall frequency of identification | ||
| + | across all resource topics. | ||
| + | |||
| + | [[File:DC Resource.jpg|center|900px]] | ||
| + | [[File:DC Resource2.jpg|center|900px]] | ||
=='''Effects of LTEMP Experimental and Management Actions''' == | =='''Effects of LTEMP Experimental and Management Actions''' == | ||
| Line 73: | Line 93: | ||
toward or away from management objectives? | toward or away from management objectives? | ||
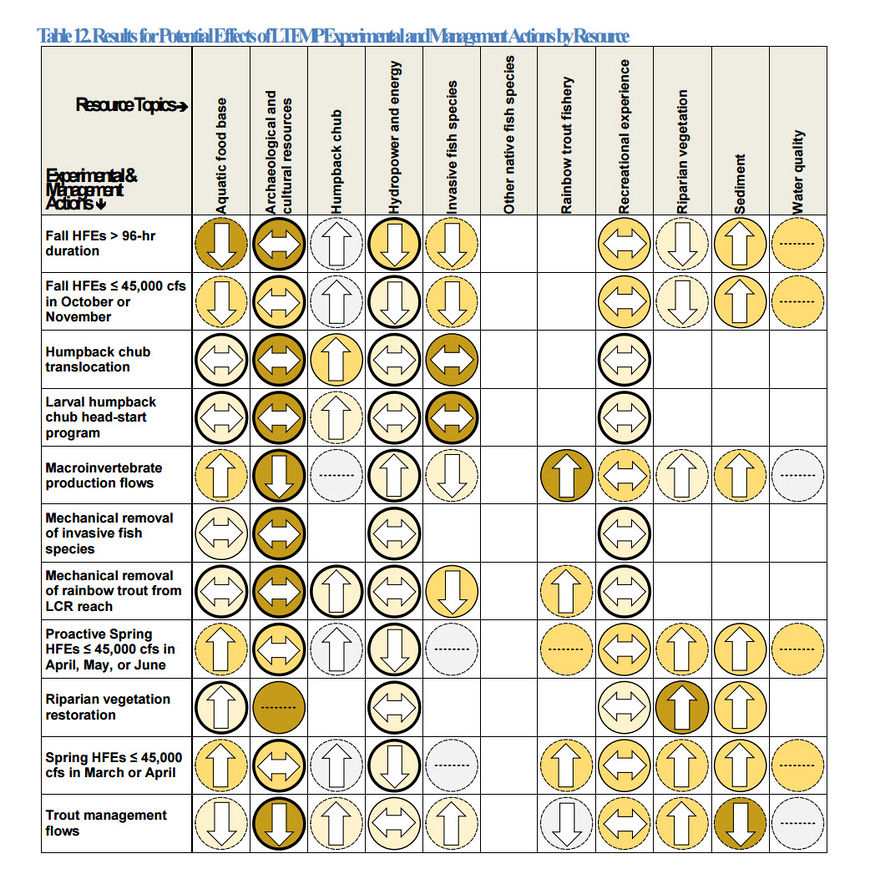
| − | [[File: | + | The results in Table 12 indicate that the expert teams expect the net effects of the various |
| + | LTEMP experimental and management actions (across all resource characteristics for the ten | ||
| + | resources) to be a “mixed bag.” Each action is expected to have a mixture of net positive to | ||
| + | negative and net strong to weak effects on each of the ten resources, on average across all the | ||
| + | individual resource characteristics for each resource. No single action is expected to consistently | ||
| + | provide a net benefit to all resources. Similarly, with the exception of recreational experience, no | ||
| + | single resource is expected to be affected consistently by all actions. In the case of recreational | ||
| + | experience, the results indicate that the expert team expects the net effects of all actions on all | ||
| + | resource characteristics to be neutral (neither positive nor negative). However, the tables in | ||
| + | Appendix D show that these average effects mask a range of variation in effects across | ||
| + | individual resource characteristics. | ||
| + | |||
| + | [[File:EMA Resource.jpg|center|870px]] | ||
| + | |||
| + | =='''Results Summary''' == | ||
| + | The results of the FY 2017 KA indicate that the expert teams considered most of the resources to | ||
| + | have current statuses of “Moderate Concern,” with two – aquatic food base and recreational | ||
| + | experience – having current statuses of “Significant Concern” and only one – invasive fish | ||
| + | species (nonnative invasive species) – having a current status of “Good Condition.” As noted | ||
| + | above, the “Good” rating for the current status of invasive fish species refers to the level of threat | ||
| + | posed by these species. The results for this one resource indicate that, overall across all invasive | ||
| + | fish species of interest, the net threat currently posed by these species is not a matter of concern. | ||
| + | At the same time, however, the expert teams consider most of the resources currently to be | ||
| + | experiencing either no trend or a deteriorating trend in status. No resource was recognized as | ||
| + | experiencing an improving trend. The four resources identified as experiencing deteriorating | ||
| + | trends are the aquatic food base, archaeological and cultural resources, hydropower and energy, | ||
| + | and the recreational experience. | ||
| + | |||
| + | =='''Recommendations''' == | ||
| + | *Establish a regular schedule of knowledge assessments, integrated with the development of at least the triennial work plans and the cumulative findings of the Annual Reporting cycle. | ||
| + | |||
| + | *The TWG and GCMRC need not repeat the assessment of knowledge about the potential effects of the LTEMP experimental and management actions. | ||
| + | |||
| + | *Every effort should be made to include the assessment of “Other Native Fishes” in all future KAs. | ||
| + | |||
| + | *Every effort should be made to ensure that future KAs include the assessment of “Tribal Resources,” however these come to be defined. | ||
| + | |||
| + | *The TWG and GCMRC should consider expanding the assessment of the “Natural Processes” resource topic to include processes other than the two included in the FY 2017 KA. | ||
| − | + | *The LTEMP and its ROD limit the “Nonnative Invasive Species” resource topic to invasive aquatic organisms, but do not limit it to fishes. The TWG and GCMRC should consider expanding the assessment of this topic to include other aquatic invasive species if ecologically appropriate. | |
| − | + | ||
| − | + | ||
| − | + | ||
| − | + | ||
| − | + | ||
| − | + | ||
| − | + | ||
| − | + | ||
| − | + | ||
| − | + | ||
| − | + | ||
<!-- | <!-- | ||
Revision as of 13:00, 3 May 2017
|
|
2017 Knowledge Assessment (KA)The FY 2017 KA had three objectives:
The resulting information provides crucial guidance for work planning and budgeting. The TWG also conceived the FY 2017 KA as a trial with two additional objectives:
The present (FY 2017) knowledge assessment is timed to coincide with and inform the Annual Reporting process and development of the next GCDAMP Triennial Work Plan for FY 2018-2020. This knowledge assessment is testing a methodology for better organizing, displaying, and communicating its findings, potentially to carry forward to guide future knowledge assessments as well. [1] |
| -- |
-- |
-- |
|---|
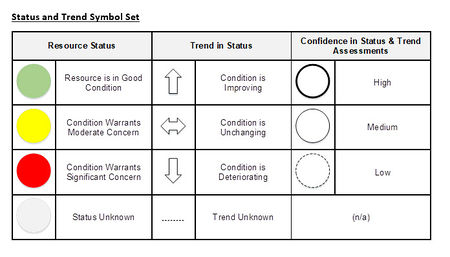
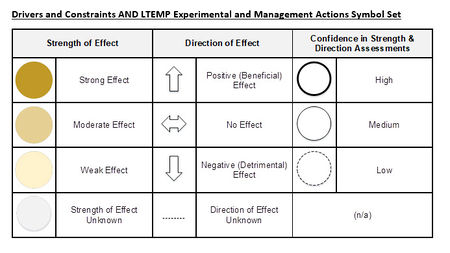
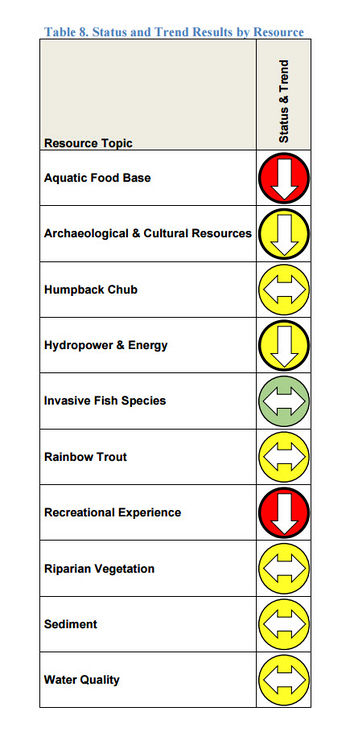
Status and TrendsHow closely does the condition of the resource currently approach management objectives and, if the current condition shows any trend, is this a trend toward or away from management objectives? Drivers and ConstraintsWhat environmental factors, including human actions and basic dam operations, most strongly affect resource status and trend, how strong are these effects, and do these effects constrain or drive resource condition toward or away from management objectives? Appendix C presents the complete set of graphic results for the drivers and constraints identified for each resource topic, averaged for each resource characteristic. Unfortunately, there is no simple way to summarize these results. As explained earlier (see Roll-Up Method, above), it is not meaningful to average the rating values for the drivers and constraints affecting an entire resource topic across all associated resource characteristics. In addition, each expert team independently developed its own list of drivers and constraints. This produced a total of 88 different driver and constraint names, with no two expert teams using the same names for any drivers and constraints. As a result, it is not possible to directly compare the ratings for individual drivers across resource topics. However, it is possible to organize the 88 drivers and constraints into a smaller number of categories. Table 10 identifies 13 categories or types of drivers and constraints, incorporating all 88 original “raw” types identified by the ten expert teams (see Appendix C). Other groupings are possible (see Recommendations, below). Table 10 also shows the numbers of individual drivers and constraints in each category, both overall and for each affected resource. Table 10 lists the proposed driver/constraint categories in order based on their overall frequency of identification across all resource topics. Effects of LTEMP Experimental and Management ActionsWhich LTEMP experimental and management actions are expected to affect resource condition and trend, how strong are these effects expected to be, and are these effects expected to drive resource condition toward or away from management objectives? The results in Table 12 indicate that the expert teams expect the net effects of the various LTEMP experimental and management actions (across all resource characteristics for the ten resources) to be a “mixed bag.” Each action is expected to have a mixture of net positive to negative and net strong to weak effects on each of the ten resources, on average across all the individual resource characteristics for each resource. No single action is expected to consistently provide a net benefit to all resources. Similarly, with the exception of recreational experience, no single resource is expected to be affected consistently by all actions. In the case of recreational experience, the results indicate that the expert team expects the net effects of all actions on all resource characteristics to be neutral (neither positive nor negative). However, the tables in Appendix D show that these average effects mask a range of variation in effects across individual resource characteristics. Results SummaryThe results of the FY 2017 KA indicate that the expert teams considered most of the resources to have current statuses of “Moderate Concern,” with two – aquatic food base and recreational experience – having current statuses of “Significant Concern” and only one – invasive fish species (nonnative invasive species) – having a current status of “Good Condition.” As noted above, the “Good” rating for the current status of invasive fish species refers to the level of threat posed by these species. The results for this one resource indicate that, overall across all invasive fish species of interest, the net threat currently posed by these species is not a matter of concern. At the same time, however, the expert teams consider most of the resources currently to be experiencing either no trend or a deteriorating trend in status. No resource was recognized as experiencing an improving trend. The four resources identified as experiencing deteriorating trends are the aquatic food base, archaeological and cultural resources, hydropower and energy, and the recreational experience. Recommendations
|
|
