Difference between revisions of "2017 Knowledge Assessment"
Cellsworth (Talk | contribs) |
Cellsworth (Talk | contribs) |
||
| Line 368: | Line 368: | ||
*Monitor trout population dynamics in response to changes in nutrients. This appears to be a promising area of research to better understand what drives RBT abundance, growth, and condition. | *Monitor trout population dynamics in response to changes in nutrients. This appears to be a promising area of research to better understand what drives RBT abundance, growth, and condition. | ||
*Continue to monitor trout population dynamics both in the LCR inflow area and the Lees Ferry Sport Fishery | *Continue to monitor trout population dynamics both in the LCR inflow area and the Lees Ferry Sport Fishery | ||
| − | *This analysis suggests that higher flow in winter and lower flow in spring increases the number of trout in a system. If managers wish to decrease recruitment, they may wish to increase flow volume in spring during a | + | *This analysis suggests that higher flow in winter and lower flow in spring increases the number of trout in a system. If managers wish to decrease recruitment, they may wish to increase flow volume in spring during a time when trout are spawning or when they are in their early life history stages. |
| − | time when trout are spawning or when they are in their early life history stages. | + | |
*Need to determine the efficacy of TMFs (magnitude, duration, frequency). | *Need to determine the efficacy of TMFs (magnitude, duration, frequency). | ||
*This analysis suggests that fish density does have a negative influence on trout size, so if managers wish to increase adult rainbow trout size they might take steps to decrease density/recruitment into the population | *This analysis suggests that fish density does have a negative influence on trout size, so if managers wish to increase adult rainbow trout size they might take steps to decrease density/recruitment into the population | ||
| Line 380: | Line 379: | ||
*Discontinue Redd counts and place greater emphasis on sampling and estimating abundance and survival of Age0 recruits. | *Discontinue Redd counts and place greater emphasis on sampling and estimating abundance and survival of Age0 recruits. | ||
*Evaluate the relationship between Rainbow Trout Maximum Size and Prey-size and abundance and Temperature in CR could be very valuable for understanding the factors that control this resource: 1). Continue monitoring the resource characteristic by field sampling efforts designed to estimate maximum size. 2). Apply modelling tools (such as drift-foraging bioenergetics or Net Energy Intake models) to predict how changing biological or physical conditions influence the maximum size that rainbow trout can attain. 3). Use both empirical studies and modeling approaches to build an explicit understanding of how management actions influence the resource. 4). Consider whether to reduce or simplify study, given angler perceptions that bioenergetic model results are already solid. | *Evaluate the relationship between Rainbow Trout Maximum Size and Prey-size and abundance and Temperature in CR could be very valuable for understanding the factors that control this resource: 1). Continue monitoring the resource characteristic by field sampling efforts designed to estimate maximum size. 2). Apply modelling tools (such as drift-foraging bioenergetics or Net Energy Intake models) to predict how changing biological or physical conditions influence the maximum size that rainbow trout can attain. 3). Use both empirical studies and modeling approaches to build an explicit understanding of how management actions influence the resource. 4). Consider whether to reduce or simplify study, given angler perceptions that bioenergetic model results are already solid. | ||
| + | |||
| + | '''Recreational experience''' | ||
| + | *Minimize duration and magnitude of experimental flows that create access issues while still accomplishing downstream resource objectives. | ||
| + | *Keep mean daily flows at a minimum of 12kcfs | ||
| + | *Minimize percent of daily fluctuations, especially during months with lower releases. | ||
| + | *Consider minimum flows/ fluctuations at 6,000-9,000cfs. | ||
| + | *Weekend water flows, holiday flows, MPF should be equivalent to mean daily flow for a given month, consider 8 kcfs as the minimum flow. | ||
| + | *Design operational flows to minimize impacts to and manage for foodbase and rainbow trout recruitment while addressing downstream resource objectives | ||
| + | *Minimize daily mean flows different than 10 kcfs and flow ranges greater than 5 kcfs during operational and experimental flows while meeting downstream resource objectives. Increase experimental flow education and outreach to anglers. | ||
| + | *Operate Glen Canyon Dam in such a manner to manage rainbow trout recruitment and promote and foodbase to meet rainbow trout specific condition measure. Implement measures to identify rainbow trout catch greater than 16 inches. | ||
| + | *Based on results from 2017 ARM meeting, consider phosphate inputs to boost macroinvertebrate production. | ||
| + | *In TMF design, consider 8 kcfs as the minimum flow, and slowing down ramp rates as much as reasonable for this experiment to be effective. | ||
| + | *Conduct HFEs whenever conditions are appropriate. Whitewater boaters recognize the positive beach building effects even with the inconvenience of very high flows | ||
| + | *Although HFE's build sandbars, they do not scour vegetation, which continues to expand into usable campsites. Consider non-native vegetation removal, within certain stretches. Vegetation management may be required to change campsite area. Develop plan for vegetation management that targets sites where re-establishment is least likely and monitor results. If campsite areas continue to decline, consider actions in addition to high flows if larger campsites are required. Short-duration high flows are effective for increasing usable campsite area. | ||
| + | *Conduct a cost benefit analysis on effects to hydropower to operate dam without daily fluctuations. | ||
| + | *During equalization years, spread high monthly releases throughout summer months to minimize the amount of sediment eroded out of the Canyon. | ||
| + | *Research needed on management action recommended to improve wilderness characteristics of Glen and Grand Canyons. | ||
| + | *Helicopter use should be for emergencies only | ||
Revision as of 13:55, 4 February 2020
|
|
2017 Knowledge Assessment (KA)The 2017 KA was carried out at the request of the TWG, with advice and support from the Science Advisors-Executive Coordinator. The following report was produced by the Science Advisors-Executive Coordinator for the TWG, the purpose of which was to review the purposes, methods, and results of the KA carried out in FY 2017, offer recommendations for improving the KA process, help the TWG use the results of this year’s KA in the development of the FY 18-20 TWP, and help the TWG decide how to proceed as to whether and how to improve the process for future budget cycles. The 2017 KA had three objectives:
The resulting information provides crucial guidance for work planning and budgeting. The TWG also conceived the FY 2017 KA as a trial with two additional objectives:
The present (FY 2017) knowledge assessment is timed to coincide with and inform the Annual Reporting process and development of the next GCDAMP Triennial Work Plan for FY 2018-2020. This knowledge assessment is testing a methodology for better organizing, displaying, and communicating its findings, potentially to carry forward to guide future knowledge assessments as well. [1] |
| -- |
-- |
-- |
|---|
IntroductionThe FY 2017 KA addressed three broad spheres of knowledge for each of these eleven focal resource topics:
More specifically, the FY 2017 KA posed three sets of core questions for each of the eleven focal resource topics:
The last of these three sets of questions focused on eleven specific experimental management actions identified in the LTEMP FEIS and ROD as features of the Preferred Alternative:
The Preferred Alternative in the LTEMP FEIS and ROD also includes summer low flow experiments. However, these will not be attempted until during the second 10 years of implementation of the LTEMP. The FY 2017 Knowledge Assessment focused on topics that might bear on the GCDAMP Triennial Work Plan for FY 2018-2020 and therefore did not address the potential effects of summer low-flow experiments. Through its answers to the three sets of core questions presented above, the FY 2017 Knowledge Assessment sought to:
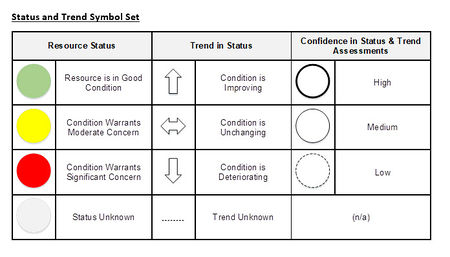
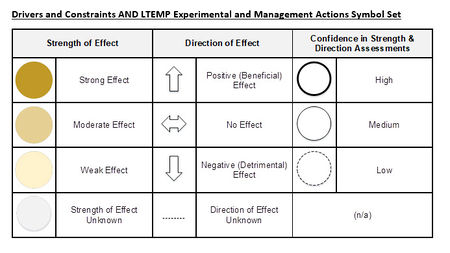
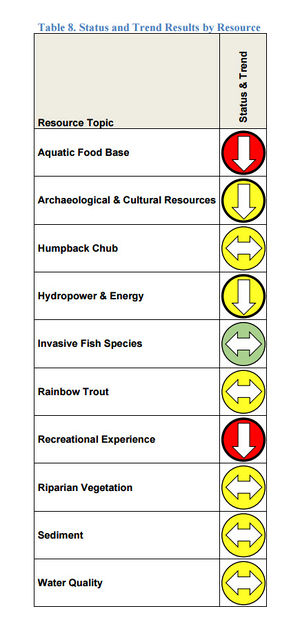
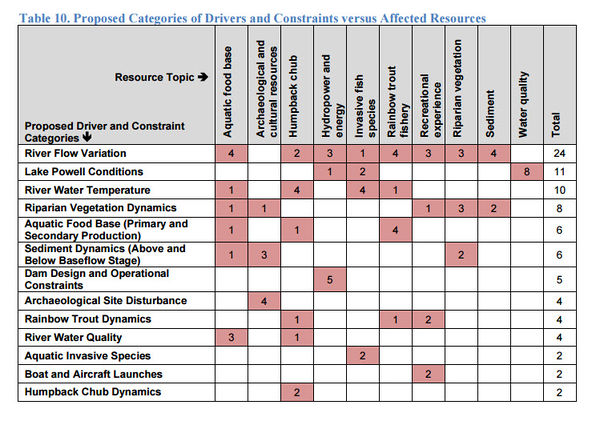
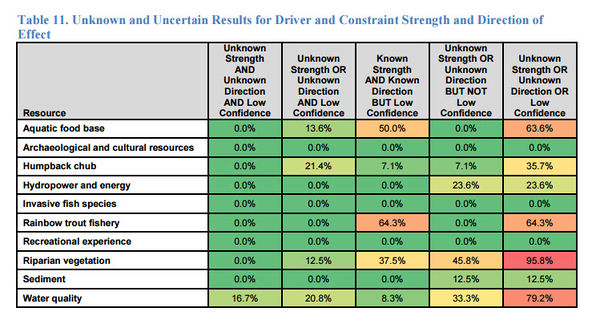
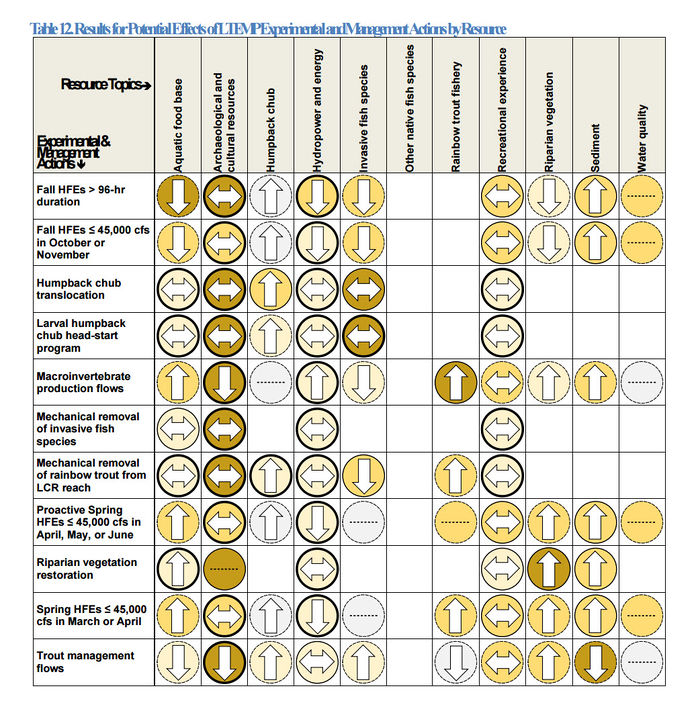
Status and TrendsThe experts for the other ten resources assessed the current status of seven overall as meeting the criteria for “Moderate Concern,” and assessed two, aquatic food base and recreational experience, as meeting the criteria for “Significant Concern” overall. Only one resource, invasive fish species (nonnative invasive species), received an overall rating of “Good Condition.” Since this last resource topic focuses on a threat, its status indicates that, nonnatives, invasive fish species overall currently pose only a limited threat to other species in the system. However, the expert teams consider six of the ten assessed resources currently to be experiencing either no net trend in status, and four – aquatic food base, archaeological and cultural resources, hydropower and energy, and the recreational experience – to be experiencing deteriorating trends in status. The experts did not identify any resource as currently experiencing a net improving trend in status. Tables outlining status and trends for each resource characteristic can be found here. Drivers and ConstraintsThe assessment of drivers and constraints identified numerous factors that influence the status of the ten assessed focal resources. These factors fall into thirteen proposed overarching categories: aquatic food base dynamics (primary and secondary production), aquatic invasive species, archaeological site disturbance, boat and aircraft launches, dam design and operational constraints, humpback chub dynamics, Lake Powell conditions, rainbow trout dynamics, riparian vegetation dynamics, river flow variation, river water quality, river water temperature, and sediment dynamics (above and below baseflow stage). Unfortunately, there is no simple way to summarize these results. As explained earlier (see Roll-Up Method, above), it is not meaningful to average the rating values for the drivers and constraints affecting an entire resource topic across all associated resource characteristics. In addition, each expert team independently developed its own list of drivers and constraints. This produced a total of 88 different driver and constraint names, with no two expert teams using the same names for any drivers and constraints. As a result, it is not possible to directly compare the ratings for individual drivers across resource topics. However, it is possible to organize the 88 drivers and constraints into a smaller number of categories. Table 10 identifies 13 categories or types of drivers and constraints, incorporating all 88 original “raw” types identified by the ten expert teams (see Appendix C). Other groupings are possible (see Recommendations, below). Table 10 also shows the numbers of individual drivers and constraints in each category, both overall and for each affected resource. Table 10 lists the proposed driver/constraint categories in order based on their overall frequency of identification across all resource topics. Effects of LTEMP Experimental and Management ActionsThe results in Table 12 indicate that the expert teams expect the net effects of the various LTEMP experimental and management actions (across all resource characteristics for the ten resources) to be a “mixed bag.” Each action is expected to have a mixture of net positive to negative and net strong to weak effects on each of the ten resources, on average across all the individual resource characteristics for each resource. No single action is expected to consistently provide a net benefit to all resources. Similarly, with the exception of recreational experience, no single resource is expected to be affected consistently by all actions. In the case of recreational experience, the results indicate that the expert team expects the net effects of all actions on all resource characteristics to be neutral (neither positive nor negative). However, the tables in Appendix D show that these average effects mask a range of variation in effects across individual resource characteristics. The assessments of status and trend, drivers and constraints, and the potential effects of LTEMP experimental and management actions for the ten assessed resources also identified numerous gaps and areas of uncertainty in critical knowledge. The resources with the highest frequencies of such gaps and uncertainties were (in descending order of frequency): water quality, riparian vegetation, the rainbow trout fishery, the aquatic food base, humpback chub, invasive fish species, and sediment. The raw spreadsheet entries indicate that the expert teams reported these gaps and uncertainties because of difficulties with unclear or undefined management objectives for individual resource characteristics; temporal or spatial gaps in the available data; insufficient numbers of suitable data points; or high temporal or spatial variability in the available data. These findings highlight topics that could benefit from improved management objectives, continuing and/or improved monitoring, and/or research to address critical gaps and uncertainties. The concluding recommendations identify needs and opportunities for the TWG and GCMRC to improve the assessment methods and their implementation under five headings: What to assess and when, assessment structure and process, the spreadsheet tool, the scorecard display system, and the default method used to average together the findings across multiple lines of evidence for each resource topic.
|
|
