Introduction
The FY 2017 KA addressed three broad spheres of knowledge for each of these eleven focal
resource topics:
- Status and Trend: How closely does the condition of the resource currently approach management objectives and, if the current condition shows any trend, is this a trend toward or away from management objectives?
- Drivers and Constraints: What environmental factors, including human actions and basic dam operations, most strongly affect resource status and trend, how strong are these effects, and do these effects constrain or drive resource condition toward or away from management objectives?
- LTEMP Experimental and Management Actions: Which LTEMP experimental and management actions are expected to affect resource condition and trend, how strong are these effects expected to be, and are these effects expected to drive resource condition toward or away from management objectives?
More specifically, the FY 2017 KA posed three sets of core questions for each of the eleven focal resource topics:
- What is the present understanding of the status of the condition(s) addressed by the topic?
- What is the present understanding of the direction of any trend(s) in these conditions?
- How certain or uncertain is this understanding?
- What is the present understanding of the drivers and constraints that most significantly shape the status and trends in these conditions?
- What is the present understanding of the strength and direction of these effects?
- How certain or uncertain is this understanding?
- Effects of Experimental and Management Actions
- What is the present understanding of the ways in which each type of LTEMP experimental or management action could affect the status and trends in these conditions?
- What is the present understanding of the likely strength and direction of these effects?
- How certain or uncertain is this understanding?
The last of these three sets of questions focused on eleven specific experimental management actions identified in the LTEMP FEIS and ROD as features of the Preferred Alternative:
The Preferred Alternative in the LTEMP FEIS and ROD also includes summer low flow experiments. However, these will not be attempted until during the second 10 years of implementation of the LTEMP. The FY 2017 Knowledge Assessment focused on topics that
might bear on the GCDAMP Triennial Work Plan for FY 2018-2020 and therefore did not
address the potential effects of summer low-flow experiments.
Through its answers to the three sets of core questions presented above, the FY 2017 Knowledge Assessment sought to:
- Summarize information on status, trends, and the state of knowledge for the eleven focal resource topics.
- Document the state of knowledge of how antecedent conditions (external drivers and constraints) may affect the outcomes of different management actions.
- Identify potential needs for continuing, increasing, reducing, revising, or adding monitoring, research, and other information-gathering efforts to address potentially crucial gaps in knowledge.
Status and Trends
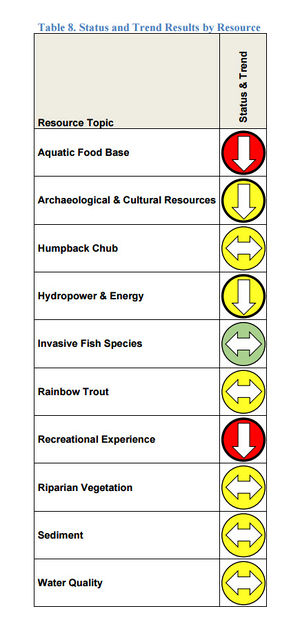
The experts for the other ten resources assessed the current status of seven overall as
meeting the criteria for “Moderate Concern,” and assessed two, aquatic food base and recreational experience, as meeting the criteria for “Significant Concern” overall. Only one resource, invasive fish species (nonnative invasive species), received an overall rating of “Good Condition.” Since this last resource topic focuses on a threat, its status indicates that, nonnatives,
invasive fish species overall currently pose only a limited threat to other species in the
system. However, the expert teams consider six of the ten assessed resources currently to be
experiencing either no net trend in status, and four – aquatic food base, archaeological and cultural resources, hydropower and energy, and the recreational experience – to be experiencing
deteriorating trends in status. The experts did not identify any resource as currently experiencing
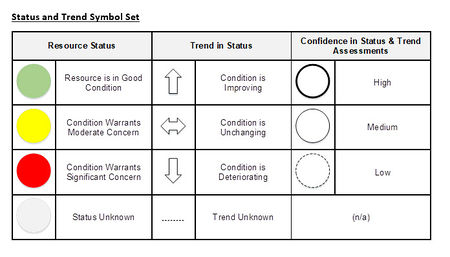
a net improving trend in status. Tables outlining status and trends for each resource characteristic can be found here.
Drivers and Constraints
The assessment of drivers and constraints identified numerous factors that influence the status of
the ten assessed focal resources. These factors fall into thirteen proposed overarching categories:
aquatic food base dynamics (primary and secondary production), aquatic invasive species, archaeological site disturbance, boat and aircraft launches, dam design and operational constraints, humpback chub dynamics, Lake Powell conditions, rainbow trout dynamics, riparian vegetation dynamics, river flow variation, river water quality, river water temperature, and sediment dynamics (above and below baseflow stage).
Unfortunately, there is no
simple way to summarize these results. As explained earlier (see Roll-Up Method, above), it is
not meaningful to average the rating values for the drivers and constraints affecting an entire
resource topic across all associated resource characteristics. In addition, each expert team
independently developed its own list of drivers and constraints. This produced a total of 88
different driver and constraint names, with no two expert teams using the same names for any
drivers and constraints. As a result, it is not possible to directly compare the ratings for
individual drivers across resource topics.
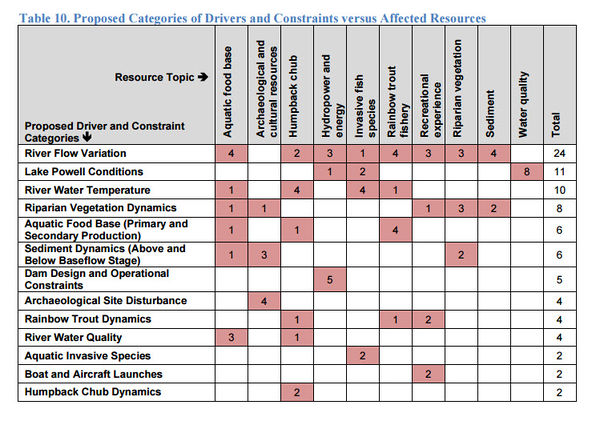
However, it is possible to organize the 88 drivers and constraints into a smaller number of
categories. Table 10 identifies 13 categories or types of drivers and constraints, incorporating all
88 original “raw” types identified by the ten expert teams (see Appendix C). Other groupings are
possible (see Recommendations, below). Table 10 also shows the numbers of individual drivers
and constraints in each category, both overall and for each affected resource. Table 10 lists the
proposed driver/constraint categories in order based on their overall frequency of identification
across all resource topics.
Effects of LTEMP Experimental and Management Actions
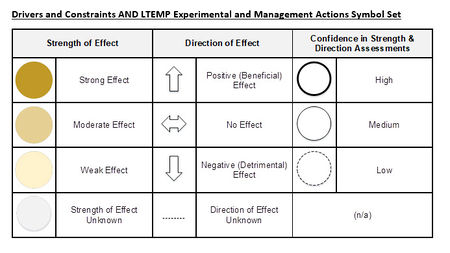
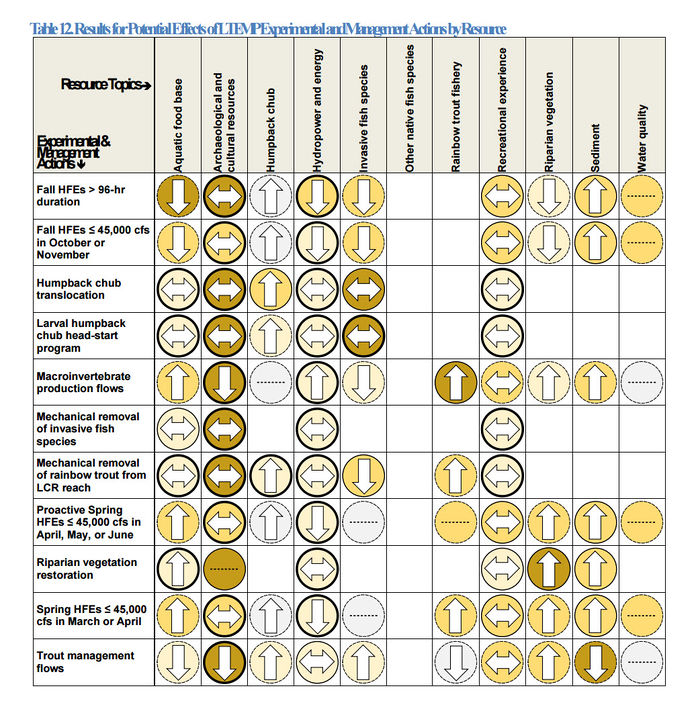
The results in Table 12 indicate that the expert teams expect the net effects of the various
LTEMP experimental and management actions (across all resource characteristics for the ten
resources) to be a “mixed bag.” Each action is expected to have a mixture of net positive to
negative and net strong to weak effects on each of the ten resources, on average across all the
individual resource characteristics for each resource. No single action is expected to consistently
provide a net benefit to all resources. Similarly, with the exception of recreational experience, no
single resource is expected to be affected consistently by all actions. In the case of recreational
experience, the results indicate that the expert team expects the net effects of all actions on all
resource characteristics to be neutral (neither positive nor negative). However, the tables in
Appendix D show that these average effects mask a range of variation in effects across
individual resource characteristics.
The assessments of status and trend, drivers and constraints, and the potential effects of LTEMP
experimental and management actions for the ten assessed resources also identified numerous
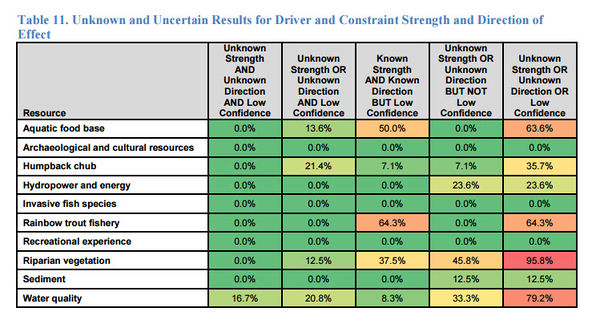
gaps and areas of uncertainty in critical knowledge. The resources with the highest frequencies
of such gaps and uncertainties were (in descending order of frequency): water quality, riparian vegetation, the rainbow trout fishery, the aquatic food base, humpback chub, invasive fish species, and sediment. The raw spreadsheet entries indicate that the expert teams reported these gaps and uncertainties because of difficulties with unclear or undefined management objectives
for individual resource characteristics; temporal or spatial gaps in the available data; insufficient
numbers of suitable data points; or high temporal or spatial variability in the available data.
These findings highlight topics that could benefit from improved management objectives,
continuing and/or improved monitoring, and/or research to address critical gaps and
uncertainties.
The concluding recommendations identify needs and opportunities for the TWG and GCMRC to
improve the assessment methods and their implementation under five headings: What to assess
and when, assessment structure and process, the spreadsheet tool, the scorecard display system,
and the default method used to average together the findings across multiple lines of evidence for
each resource topic.
Participants
- Aquatic Food Base: Ted Kennedy (Team Lead), Jeff Muehlbauer, Chris Budwig, Shane Capron, Bill Davis, Craig Ellsworth
- Archaeological and Cultural Resources: Jan Balsom (Team Lead) and Jen Dierker
- Humpback Chub: Charles Yackulic (Team Lead), Randy Van Haverbeke, Kirk Young
- Hydropower and Energy: Craig Ellsworth (Team Lead), Shane Capron, Clayton Palmer, Dave Welker, Chrystal Dean (WAPA); Paul Davidson and Nick Williams (Reclamation); Lucas Bair (GCMRC); Leslie James (CREDA); Cliff Barrett (UAMPS); Jenika Raub (SRP); Ben Reeder (SEAHG chair); Peggy Roefer (CRC); Arash Moelemi (NTUA)
- Invasive Fish Species: David Rogowski (Team Lead), Ken Hyde
- Other Native Fish Species: Brian Healy (not completed)
- Rainbow Trout Fishery: Mike Yard (Team Lead), Clay Nelson, Michael Dodrill, and Kimberly Dibble, with Chris Budwig, John Jordan, John Hamill, and Joe Miller
- Recreational Experience: Lucas Bair (Team Lead), Ben Reeder, Chris Budwig, Kevin Dahl, David Rogowski
- Riparian Vegetation: Emily Palmquist (Team Lead), Barb Ralston, Joel Sankey, John Spence, Larry Stevens
- Sediment: Paul Grams (Team Lead), David Topping (Team Lead), Joel Sankey, and Helen Fairley with Lucas Bair, Daniel Buscombe, Joseph Hazel, Erich Mueller, and Jack Schmidt
- Tribal Cultural Values: tbd
- Water Quality: Robert Radtke (Team Lead), Marianne Crawford, Katrina Grantz; Bridget Deemer, Charles Yackulic, Nicholas Voichick; Peggy Roefer (Team Lead); Todd Tietjen; Mark Anderson
|
Links and Information
|
|
|
Reports
|
|
|
Final Knowledge Assessment Summary Tables for All Resources (4/24/17)
|
|
|
Presentations
|
|
|
Final Knowledge Assessment Tables for Individual Resources (4/7/17)
|
|
|
Report Recommendations
|
What to Assess and When
- Establish a regular schedule of knowledge assessments, integrated with the development of at least the triennial work plans and the cumulative findings of the Annual Reporting cycle.
- The TWG and GCMRC need not repeat the assessment of knowledge about the potential effects of the LTEMP experimental and management actions.
- Every effort should be made to include the assessment of “Other Native Fishes” in all future KAs.
- Every effort should be made to ensure that future KAs include the assessment of “Tribal Resources,” however these come to be defined.
- The TWG and GCMRC should consider expanding the assessment of the “Natural Processes” resource topic to include processes other than the two included in the FY 2017 KA.
- The LTEMP and its ROD limit the “Nonnative Invasive Species” resource topic to invasive aquatic organisms, but do not limit it to fishes. The TWG and GCMRC should consider expanding the assessment of this topic to include other aquatic invasive species if ecologically appropriate.
Assessment Structure and Process
- The TWG should make clear from the outset precisely what objectives the expert teams should to use for each resource topic, against which to assess status and trend.
- The process and its guidance need to be improved to encourage the expert teams to address a smaller number of truly “key” resource characteristics for each focal resource.
- The expert teams need to be encouraged to read and follow the formal guidance for the KA – and conversely to provide feedback on how the guidance could be improved.
- Integration of the work of the individual expert teams could be improved by developing a standard, master list of drivers and constraints.
- The FY 2017 KA did not address or could have better addressed some environmental factors that recent Annual Reporting Meetings, past KAs, and GCMRC publications have identified as potentially relevant to the GCDAMP.
- Integration of the results from repeated KAs would also benefit from the development of standardized lists of resource characteristics for each focal resource topic, the GCDAMP FY 2017 Knowledge Assessment Final Report, Executive Coordinator for the Science Advisors Program examination of which could be repeated in successive KAs.
- The KA process would benefit from the formal inclusion of the effort in annual or triennial work plans, so that all participating experts know this will be an expected matter of attention.
- The schedule for each KA should include a more formally recognized period or opportunity for all stakeholders to provide feedback to the expert teams.
- The TWG has proposed, and Reclamation and the SAP-EC have requested in the draft FY 2018-2020 Triennial Work Plan and Budget, that the GCDAMP re-establish a “Standing Panel” as part of the SAP, to provide routine review services to the GCDAMP.
Spreadsheet Tool
- The FY 2017 KA expert teams – or at least the team leaders – should be polled for feedback on the spreadsheet tool, on ways in which the tool or its associated guidance might be improved.
- The spreadsheet should include places where the expert teams can or record or find several additional pieces of information, including:
- Explicit documentation of the objectives and benchmarks used for assessing status and trend
- The definitions of all resource characteristics and technical measures addressed in the KA
- The definitions of all drivers and constraints addressed in the KA (see recommendations above on Knowledge Assessment Structure and Process)
- Citations for important reference works relevant to ratings and considered in rationale narratives.
- The “Unknown” category for status, trend, strength, and direction could be split into two variants to recognize two possibilities: there may not be enough evidence with which to even attempt an assessment, or the available evidence, while perhaps nominally sufficiently plentiful, may be too “noisy” to support any firm conclusion.
- The guidance provided with the spreadsheet tool, and the Data Validation functions incorporated into the tool, should be improved to promote greater consistency in how the expert teams fill in the tables in the tool.
|
Resource Recommendations
|
|
Aquatic food base
- Consider 3 consecutive years of macroinvertebrate production flows to see if reduced egg mortality during weekends leads to higher drift concentrations during weekday hydropeaking.
- Consider additional studies of interrelationships between discharge fluctuations and drift.
- Consider testing spring timed HFEs, because the timing of HFEs may influence substrate quality. Recent fall HFEs appear to be promoting colonization by aquatic macrophytes, which provide habitat for invasive New Zealand mudsnails. Spring HFEs likely knock back macrophytes to a greater degree than fall HFEs.
- Consider how timing of spring HFEs might actually be used to mitigate strong trout recruitment response (i.e., would April HFE stimulate food base and not create as many small trout as compared to early March HFE?).
- Consider assessing shorter-term effects of HFEs on foodbase, rather than year-averaged trends.
- Consider studies that compare habitat quality of cobble/gravel in Glen vs. Grand Canyon and that include direct manipulations of substrates (power washing cobbles, scraping cobbles).
- In the absence of a switch in HFE timing, consider studies that disturb macrophytes in spring and/or fall (e.g., by raking or dredging) to understand how HFE timing affects macrophyte response.
- TMFs are unlikely to be positive for food base. Given that fish in the GCD tailwater are food-limited, do not recommend TMFs as a way to improve food base diversity.
- Consider modeling what effect low summer steady flows might have on drift concentrations and bioenergetics of fish.
- Complete analysis of longterm drift monitoring data.
- Ensure robust monitoring is in place during next equalization flow.
- Continued monitoring of invertebrate drift combined with dissolved oxygen monitoring will help resolve effects of DO on drift. Consider additional, direct studies on DO effects on invertebrates.
- Continued drift and light trap monitoring in Glen, Marble, and Grand Canyon will help clarify role of turbidity in constraining secondary production (drift and emergence production).
- Begin monitoring nutrients downstream. Evaluate feasibility of nutrient supplementation program.
- Consider regular stable isotope analysis of aquatic insects captured in light traps and drift nets to clarify trophic-basis of insect production (i.e., leaf litter vs. algae) in Lees Ferry and Grand Canyon.
- Consider repatriation of native Colorado River invertebrates such as caddisflies from Davis and Parker to "jump start" colonization.
- Consider new research at Hoover, Davis and Parker Dams to better understand life history of the caddisflies that are abundant in Davis and Parker segments, which have substantially greater hydropeaking than in Glen.
- Consider investigating temperature tolerances of Tapeats invertebrates.
- Conduct stress tests of invertebrate assemblages (growth experiments over extreme range of water temperatures on current "Big 4" taxa) to identify how the nearctic assemblages present downstream of Glen Canyon Dam will respond to the very warm water temperatures that may occur in the future.
- Consider benthic monitoring in FY18-20 to track downstream progression of quagga.
- Consider new research studies of macrophyte-invertebrate interactions to better understand role of macrophytes in driving changes in invertebrate prey base, especially in LF.
Archaeological and cultural resources
- Resume monitoring w/NPS and Tribes. Re-establish monitoring program using NPS/ASMIS protocols.
- Expand stage elevation model for HFEs to include GLCA Reach.
- Establish and implement targeted monitoring pre and post HFE's.
- Support NPS and Tribal monitoring efforts and coordination with GRCA CRMP and law enforcement patrol; integrate monitoring information with education and mitigation efforts.
- Continue submerged monitoring of Spencer Steamboat.
Humpback chub
Hydropower and energy
- Make sure to consider hydrology and water use and how they affect resource characteristics. Make sure these resources are considered when planning for changes in water use.
- Keep the analysis updated past LTEMP.
- Move forward on cost/benefit analysis on adding generation on the bypass tubes.
- Look for ways of increasing reservoir elevation at Lake Powell.
- Look for ways to conduct experiments coincident with power production.
- Identify maintenance costs for bypass tubes/valves and clarify funding source for this maintenance.
- Evaluate whether extended duration HFEs result in larger and longer‐lasting sandbars in critical reaches
Invasive fish species
- Maintain or reduce current spawning numbers of Brown Trout in Lees Ferry Reach to protect Rainbow Trout and Humpback Chub fishery
- Reduce conditions that promote increased recruitment and numbers of Brown Trout
- Continue fish weir at Bright Angel Creek, and possibly other tributaries if Brown Trout spawning/recruitment is occurring there
- Continue monitoring for rare-nonnatives
Other Native Fish Species
Rainbow trout fishery
- Continue monitoring the recruitment of age0 fish that disperse from Lees Ferry into Marble Canyon during the late-summer and fall at Houserock Reach.
- Monitor trout population dynamics in response to changes in nutrients. This appears to be a promising area of research to better understand what drives RBT abundance, growth, and condition.
- Continue to monitor trout population dynamics both in the LCR inflow area and the Lees Ferry Sport Fishery
- This analysis suggests that higher flow in winter and lower flow in spring increases the number of trout in a system. If managers wish to decrease recruitment, they may wish to increase flow volume in spring during a time when trout are spawning or when they are in their early life history stages.
- Need to determine the efficacy of TMFs (magnitude, duration, frequency).
- This analysis suggests that fish density does have a negative influence on trout size, so if managers wish to increase adult rainbow trout size they might take steps to decrease density/recruitment into the population
- Consider actions which likely increase benthic production of invertebrates (the ultimate source of invertebrate drift), including the role nutrients play.
- Consider implementation of Macroinvertebrate production flows and experimentally examine how flows influence the foodbase, which influences invertebrate drift availability and ultimately trout growth.
- Use targeted trout management flows to test hypothesis, when conditions are appropriate (i.e. Brown trout control).
- Research is needed to determine what is the major factor determining variation in aquatic preybase. As a response variable, trout need to be monitored for effects from high flow experiments and reservoir nutrient dynamics.
- Annual recruitment of Age0 trout is a critical information for determining the likely trends in population growth. Need to reconcile the differences in recruitment found between RTELLS catch indices and mark-recapture estimates. Suggest re-estimating RTELLS capture probabilities since these have not been revised since 2007.
- We suggest monitoring the movement of age-0 trout into Marble Canyon to assess future increases in trout abundance due to recruitment in Marble Canyon, as well as efficacy of Trout Management Flows to reduce recruitment events in Lees Ferry.
- Discontinue Redd counts and place greater emphasis on sampling and estimating abundance and survival of Age0 recruits.
- Evaluate the relationship between Rainbow Trout Maximum Size and Prey-size and abundance and Temperature in CR could be very valuable for understanding the factors that control this resource: 1). Continue monitoring the resource characteristic by field sampling efforts designed to estimate maximum size. 2). Apply modelling tools (such as drift-foraging bioenergetics or Net Energy Intake models) to predict how changing biological or physical conditions influence the maximum size that rainbow trout can attain. 3). Use both empirical studies and modeling approaches to build an explicit understanding of how management actions influence the resource. 4). Consider whether to reduce or simplify study, given angler perceptions that bioenergetic model results are already solid.
Recreational experience
- Minimize duration and magnitude of experimental flows that create access issues while still accomplishing downstream resource objectives.
- Keep mean daily flows at a minimum of 12kcfs
- Minimize percent of daily fluctuations, especially during months with lower releases.
- Consider minimum flows/ fluctuations at 6,000-9,000cfs.
- Weekend water flows, holiday flows, MPF should be equivalent to mean daily flow for a given month, consider 8 kcfs as the minimum flow.
- Design operational flows to minimize impacts to and manage for foodbase and rainbow trout recruitment while addressing downstream resource objectives
- Minimize daily mean flows different than 10 kcfs and flow ranges greater than 5 kcfs during operational and experimental flows while meeting downstream resource objectives. Increase experimental flow education and outreach to anglers.
- Operate Glen Canyon Dam in such a manner to manage rainbow trout recruitment and promote and foodbase to meet rainbow trout specific condition measure. Implement measures to identify rainbow trout catch greater than 16 inches.
- Based on results from 2017 ARM meeting, consider phosphate inputs to boost macroinvertebrate production.
- In TMF design, consider 8 kcfs as the minimum flow, and slowing down ramp rates as much as reasonable for this experiment to be effective.
- Conduct HFEs whenever conditions are appropriate. Whitewater boaters recognize the positive beach building effects even with the inconvenience of very high flows
- Although HFE's build sandbars, they do not scour vegetation, which continues to expand into usable campsites. Consider non-native vegetation removal, within certain stretches. Vegetation management may be required to change campsite area. Develop plan for vegetation management that targets sites where re-establishment is least likely and monitor results. If campsite areas continue to decline, consider actions in addition to high flows if larger campsites are required. Short-duration high flows are effective for increasing usable campsite area.
- Conduct a cost benefit analysis on effects to hydropower to operate dam without daily fluctuations.
- During equalization years, spread high monthly releases throughout summer months to minimize the amount of sediment eroded out of the Canyon.
- Research needed on management action recommended to improve wilderness characteristics of Glen and Grand Canyons.
- Helicopter use should be for emergencies only
Riparian vegetation
- Continued ground-survey and aerial image monitoring of changes to herbaceous and woody species and non-native spp. to track shifts in Tamarix defoliation and subsequent infilling by other species. Compare the CRe flora to that of Cataract Canyon to get an general idea of how these somewhat similar sections of the Colorado River compare - would require extra field work and collaboration with Canyonlands NP and the Northern Colorado Plateau Network. Measures of community heterogeneity need to be tied to a specific management question, so an appropriate measure can be used.
- Continue work using flow-response guilds to examine likely functional group changes due to different flow regimes and likely functional group changes that impacted historic sandbar change (two current projects). Study functional group response/shifts and model using flow scenario.
- Continue research and monitoring that improves our understanding of how vegetation impacts fluvial and aeolian sediment transport.
- Reexamine the areal extent and composition of marsh habitats using the more recent areal imagery and ground-surveys.
- Develop a science-based vegetation management (e.g., restoration, rehabilitation, or other active management) plan with measurable goals. Allocate time and money based on goals to track success. What to do with the dead, standing Tamarix may be a topic to consider in the future.
- Using genetic studies and field data, we could examine if HFE's are selecting for clonal species and genotypes.
Sediment
- Continue monitoring and expand sample sizes to increased confidence in strength and direction determinations.
- Develop study plan for proactive and extended duration HFE's before implementation.
- If vegetation management occurs, monitor sandbar response in future high flows.
- Continue monitoring sand storage. If persistent declines in storage occur, considering revising action.
Tribal Cultural Values
Water quality
- Reinstall temperature string on the Lake Powell side of GCD. Monitor forebay of GCD on a monthly basis to determine trends and analyze data collected in the past. It is difficult to assess a status and trend without identifying specific scenarios of concern. Gather data necessary to determine lake hydrodynamics including temperature data at the inflows (Colorado River and San Juan River). Utilize the results of an Protocols Evaluation Panel or Science Advisors Panel to determine location and frequency.
- Monitor forebay of GCD on a monthly basis to determine trends. Monitor Lake Powell at an interval determined by the results of an Protocols Evaluation Panel or Science Advisors Panel, analyze data collected in the past with special emphasis on metalimnetic oxygen minima and CBOD. More thoroughly monitor DO concentrations in Lake Powell during HFE (e.g., twice daily data, coupled with profile at dam)-- jet tubes significantly increase the DO in the river, would be good to understand the combination of DO from penstock and DO from jet tubes.
- Monitor Lake Powell at an interval determined by the results of an Protocols Evaluation Panel or Science Advisors Panel, analyze data collected in the past. Measure conductivity of inflow of Lake Powell at Colorado River and San Juan River.
- Analyses for nutrients should be routinely collected monthly (as scheduled) above and below GCD (forebay and Lees Ferry.. and further downstream). Timing of riverine nutrient sampling should be standardized. Given the extremely low concentrations of phosphorus in this system, the contract laboratory should be consulted to see if a new method might be able to lower the detection limits. More time should be spent analyzing the historical nutrient data collected in Lake Powell. Some protocol should also be developed to establish the representativeness of the Lake Powell-Wahweap station penstock depth sample in reflecting the water chemistry and biology exiting Lake Powell. Follow PEP recommended targeted sampling to better understand the drivers of nutrient patterns in the lake and the nutrient limitation regime below GCD.
- Samples for phytoplankton, zooplankton, and chlorophyll should be collected monthly above and below GCD. Monitor Lake Powell at an interval determined by the results of an Protocols Evaluation Panel or Science Advisors Panel, analyze data collected in the past at key locations to determine the impact of quagga mussels on the reservoir and other trends. There is a need to determine whether the data collected in Lake Powell is correlated to the data at Lees Ferry.
- Data should be collected above and below GCD and in Lake Powell at an adequate frequency to determine status and trends as determined by the results of an Protocols Evaluation Panel or Science Advisors Panel. Analyze data collected in the past. Explore work conducted by other researchers on mercury in Lake Powell.
- Monitor Lake Powell at an interval determined by the results of an Protocols Evaluation Panel or Science Advisors Panel, analyze data collected in the past at key locations to determine trends.
|
|
